While I was processing the instrument response star for my 3C 273 data, I found I was unable to
get Isis to display spectra data below 3950 and above 7595 angstroms. My profile of SAO119503 looked
full of interesting absorptions/emission lines from 3750-8300A (btw I know some of the IR is 2nd order);see:
https://goo.gl/photos/5nPu1WTjrowqZeJj7
---NOTE: I darkened the "unobtainable" spectral regions grey in PS, not an Isis graphic function!-------
But when processing this star for Instrument response, my data (after flats) was "too noisie" to get anything
below or above the wavelength limits (3950 & 7595) mentioned above.
Are my flats too under or over exposed? See the process 3C 273 (15x180sec 2x2 binned images) spectra:
https://goo.gl/photos/DyYQkUMpPNiQ6Lk19
I did as Christian recommended and made the flats about 55K ADUs as read in MaximDL's Medium stretch window.
Should I exposure them more or is it another issue?
I hate getting good data that I cant make ISIS reduce into useful spectral continuum.
James
Isis processing issues
-
James Foster
- Posts: 439
- Joined: Sun Jan 24, 2016 7:14 am
Isis processing issues
James Foster
eShel2-Zwo ASI6200MM Pro
Lhires III (2400/1800/600 ln/mm Grat) Spectroscope
LISA IR/Visual Spectroscope (IR Configured)
Alpy 200/600 with Guide/Calibration modules and Photometric slit
Star Analyzer 200
eShel2-Zwo ASI6200MM Pro
Lhires III (2400/1800/600 ln/mm Grat) Spectroscope
LISA IR/Visual Spectroscope (IR Configured)
Alpy 200/600 with Guide/Calibration modules and Photometric slit
Star Analyzer 200
-
Robin Leadbeater
- Posts: 1928
- Joined: Mon Sep 26, 2011 4:41 pm
- Contact:
Re: Isis processing issues
Hi James,
The problem is not ISIS. It is a consequence of the combination of the characteristic low output in the tungsten halogen flat lamp in the blue and the drop off in sensitivity of the grating and camera at the blue and red end when taking spectra over the full range. Assuming you have enough signal from the star in these areas, the solution is to sum many well exposed flats to get enough counts in the blue region while not saturating the middle region. (For the ALPY I typically take 30 flats, exposed to ~50% of the saturation level and the further you want to go into the blue the more you need. This also applies to the bias and darks. You need to sum enough to make sure they are not adding significantly to the noise.)
Note also that the flat corrected image looks much worse than it actually is in practise. (your flat corrected image looks quite typical to me) This is because the result of applying the flat is to effectively "turn up the gain" at the blue and red end. Did you complete the data reduction or stop when you saw the flat corrected image ?
Cheers
Robin
LHIRES III #29 ATIK314 ALPY 600/200 ATIK428 Star Analyser 100/200 C11 EQ6
http://www.threehillsobservatory.co.uk
http://www.threehillsobservatory.co.uk
-
Robin Leadbeater
- Posts: 1928
- Joined: Mon Sep 26, 2011 4:41 pm
- Contact:
Re: Isis processing issues
Here is an example of one of my reference stars. The noise in the flat corrected image in the blue end looks bad but the resulting response corrected spectrum is fine. (blue is the measured spectrum, pink is the actual spectrum from the MILES library)
Cheers
Robin
Cheers
Robin
- Attachments
-
- violet_region_measured_v_library.png (127.61 KiB) Viewed 6669 times
LHIRES III #29 ATIK314 ALPY 600/200 ATIK428 Star Analyser 100/200 C11 EQ6
http://www.threehillsobservatory.co.uk
http://www.threehillsobservatory.co.uk
-
James Foster
- Posts: 439
- Joined: Sun Jan 24, 2016 7:14 am
Re: Isis processing issues
To: Robin,,
Thanks for the quick response!
RE:" Did you complete the data reduction or stop when you saw the flat corrected image ?"
Yes I did. Just for your info, I used 25 flats with a average ADU of 55K. I used the "Master" tab
to generate the MASTER offset_7 (from 19 bias 2x2 binned images at -7 deg) and dark600_7
(from 7x600sec darks, 2x2 bin at -7 deg). I also produced the cosme.lst file and a master flat
from the 25 flats (each one at 8.5 sec 2x2 bin, dark and bias calibrated to get to 55K ADU).
I know I'm "greedy" for wavelength band coverage and Isis allowed me to get this background subtracted
spectrum of 3C 273 in an urban sky setting:
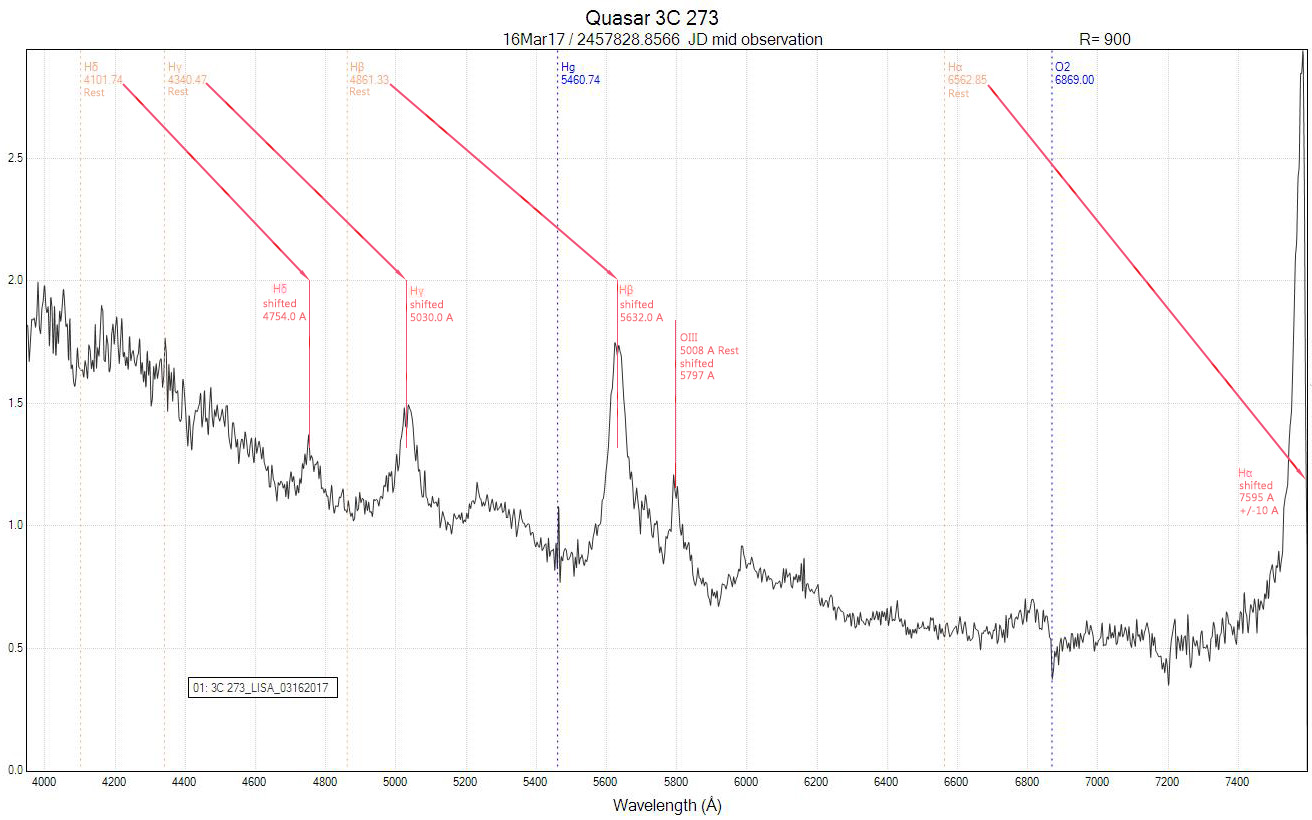
But the "fidelity" of the response A0V star in the near UV and IR seems to indicate I should get more
spectral coverage; as you indicated my flat data and/or response star exposure was probably too short.
Another clue is the strange of "malformed" response profile I get when I run the Response Assistant; see:
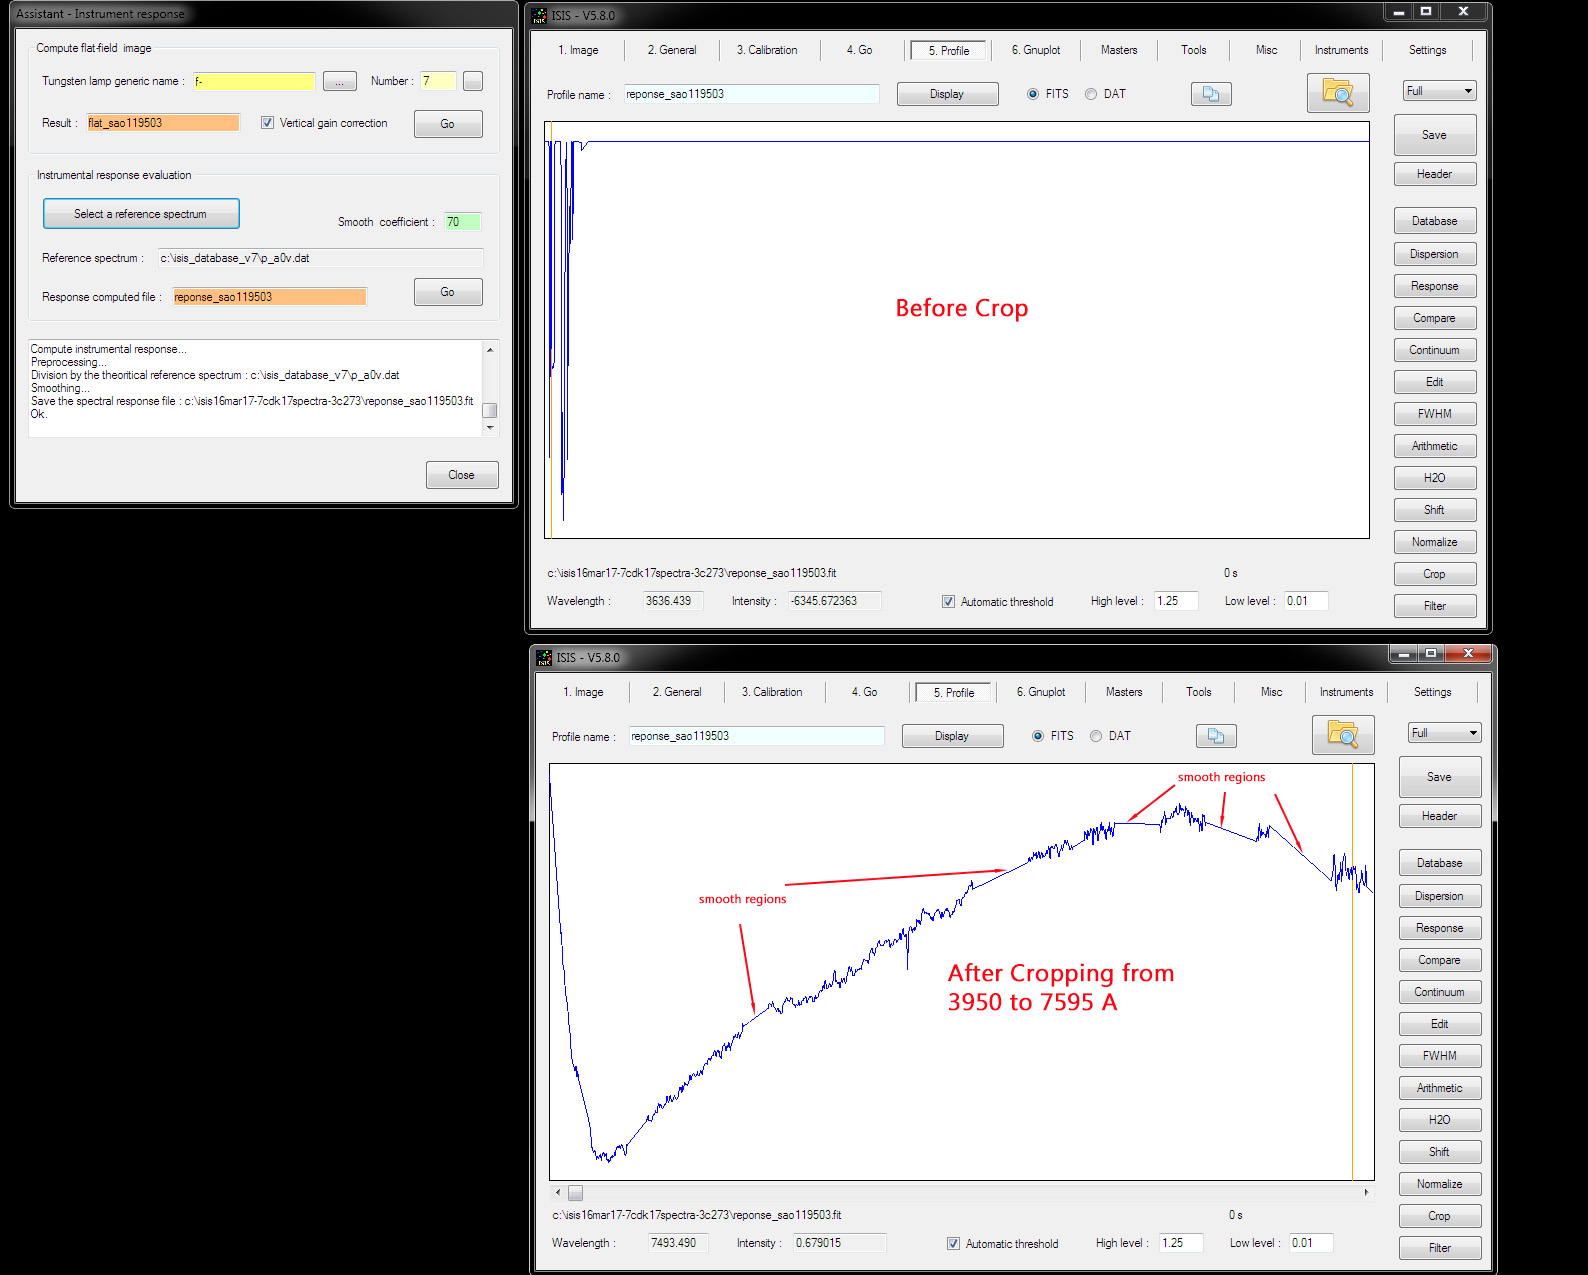
[NOTE: I used only 7 flats on this response, but the number of flats and/or the smooth coefficient does not alter the scaling problem or "smooth regions"]
One other thing I noticed in Isis calibration routine is that it use the the very faint 5944.83 A neon line instead of the more
prominent Ne or Ar lines. Is there a way to change this? I tried omitting this line in the dispersion list and also tried the "per-defined"
LISA (Ar visible), LISA (Ar IR), and LISA (internal Ne lamp) in the general tab, spectral calibration box, but to no avail, the
x coordinate of line at wavelength box always reverted back to that dim Ne line of 5944.83 A; my poor keyboard suffered some physical abuse
out of my frustrations.......lol!
Right now, I'm going to quadruple my neon exposures and take flats going to ADU value of 59K and triple my exposure to reach good SNR
for the blue and IR ends of my objects/response stars.
Isis is a great spectral reduction program, but I wish it had a more through explanation on what each input does and alternates
on how to customize reductions for multiple spectral set-ups.....it will be a long time til' I attempt to use this program to reduce
my CaK and Hy Solar Analog data using the 1800 l/mm grating on my L-200!
James
Thanks for the quick response!
RE:" Did you complete the data reduction or stop when you saw the flat corrected image ?"
Yes I did. Just for your info, I used 25 flats with a average ADU of 55K. I used the "Master" tab
to generate the MASTER offset_7 (from 19 bias 2x2 binned images at -7 deg) and dark600_7
(from 7x600sec darks, 2x2 bin at -7 deg). I also produced the cosme.lst file and a master flat
from the 25 flats (each one at 8.5 sec 2x2 bin, dark and bias calibrated to get to 55K ADU).
I know I'm "greedy" for wavelength band coverage and Isis allowed me to get this background subtracted
spectrum of 3C 273 in an urban sky setting:
But the "fidelity" of the response A0V star in the near UV and IR seems to indicate I should get more
spectral coverage; as you indicated my flat data and/or response star exposure was probably too short.
Another clue is the strange of "malformed" response profile I get when I run the Response Assistant; see:
[NOTE: I used only 7 flats on this response, but the number of flats and/or the smooth coefficient does not alter the scaling problem or "smooth regions"]
One other thing I noticed in Isis calibration routine is that it use the the very faint 5944.83 A neon line instead of the more
prominent Ne or Ar lines. Is there a way to change this? I tried omitting this line in the dispersion list and also tried the "per-defined"
LISA (Ar visible), LISA (Ar IR), and LISA (internal Ne lamp) in the general tab, spectral calibration box, but to no avail, the
x coordinate of line at wavelength box always reverted back to that dim Ne line of 5944.83 A; my poor keyboard suffered some physical abuse
out of my frustrations.......lol!
Right now, I'm going to quadruple my neon exposures and take flats going to ADU value of 59K and triple my exposure to reach good SNR
for the blue and IR ends of my objects/response stars.
Isis is a great spectral reduction program, but I wish it had a more through explanation on what each input does and alternates
on how to customize reductions for multiple spectral set-ups.....it will be a long time til' I attempt to use this program to reduce
my CaK and Hy Solar Analog data using the 1800 l/mm grating on my L-200!
James
James Foster
eShel2-Zwo ASI6200MM Pro
Lhires III (2400/1800/600 ln/mm Grat) Spectroscope
LISA IR/Visual Spectroscope (IR Configured)
Alpy 200/600 with Guide/Calibration modules and Photometric slit
Star Analyzer 200
eShel2-Zwo ASI6200MM Pro
Lhires III (2400/1800/600 ln/mm Grat) Spectroscope
LISA IR/Visual Spectroscope (IR Configured)
Alpy 200/600 with Guide/Calibration modules and Photometric slit
Star Analyzer 200
-
Paul Luckas
- Posts: 101
- Joined: Tue Jun 24, 2014 5:08 pm
- Location: Perth, Western Australia
Re: Isis processing issues
Hi James,
Re: response assistant.
I've sometimes found it necessary to increase the smoothing coefficient to bizarrely large values for Alpy spectra (see screen shot). Also, it's possible to compare the results of using different coefficients to the standard by disabling the deletion of intermediate files (found on the settings tab). The compare file is called @@.fit.
Paul
- smooth_coeff.PNG (62.67 KiB) Viewed 6644 times
-
Robin Leadbeater
- Posts: 1928
- Joined: Mon Sep 26, 2011 4:41 pm
- Contact:
Re: Isis processing issues
Hi James,
I'm not sure what is going wrong in this case. With those masters it should have been possible to get a good response way below 3900. Here for example is my response calculated using the MILES reference star from my previous post.
Robin
I'm not sure what is going wrong in this case. With those masters it should have been possible to get a good response way below 3900. Here for example is my response calculated using the MILES reference star from my previous post.
Robin
- Attachments
-
- _hd27819_20161105_970_response.png (3.84 KiB) Viewed 6618 times
LHIRES III #29 ATIK314 ALPY 600/200 ATIK428 Star Analyser 100/200 C11 EQ6
http://www.threehillsobservatory.co.uk
http://www.threehillsobservatory.co.uk
-
James Foster
- Posts: 439
- Joined: Sun Jan 24, 2016 7:14 am
Re: Isis processing issues
To: Paul,
Thanks for the screen prints.....in my case...using huge Smooth coefficients makes the response curve look better.
To: Robin,
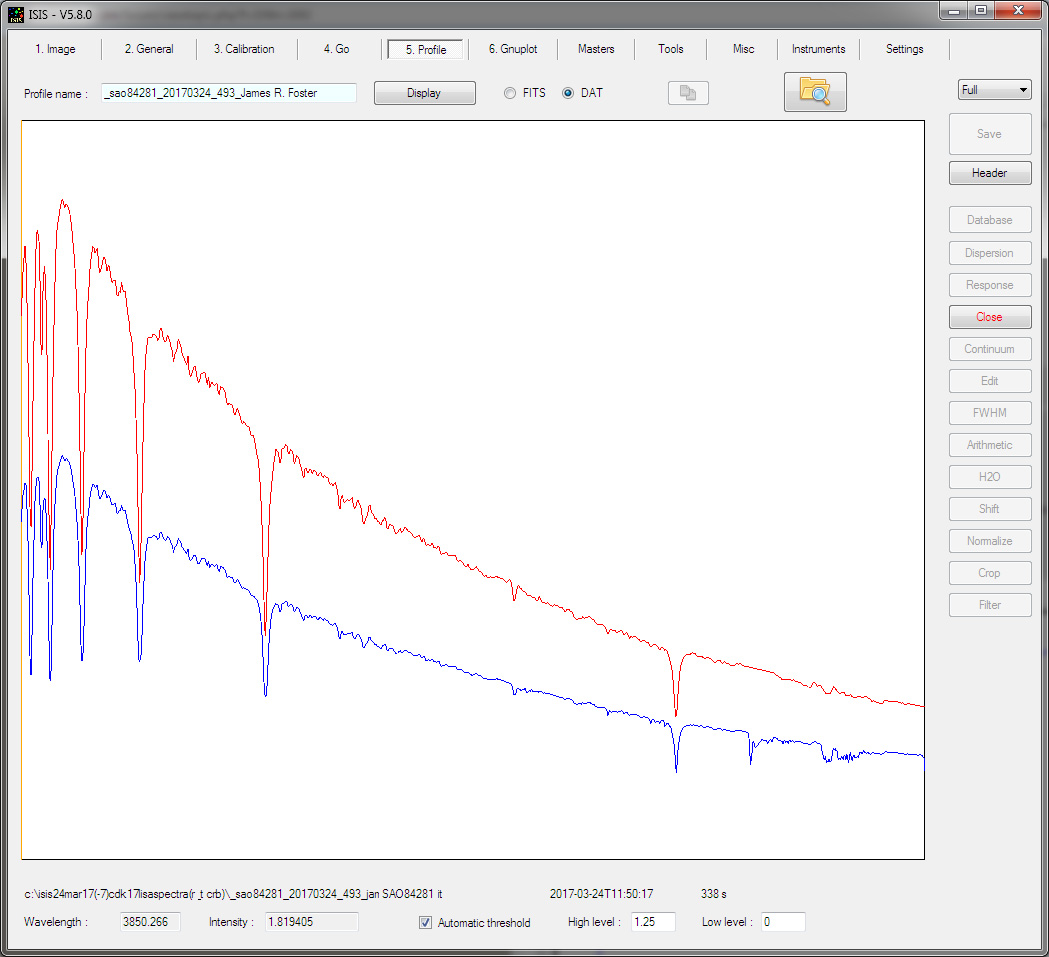
All my response curves look like Paul's or worse; mostly way worse. Seems all my respose curves turn-out like straight vertical lines unless I crop. If I crop too much into the UV (say shortward of 3800A) the curves stay vertical lines! More recently I've gotten a response curves that causes the reference A-star spectrum to be perfectly shaped to the Miles, but it ends up either above or below the reference star's process spectrum; see this example of a A3V star SAO84281, next to R & T CrB:
I have never yet, after processing 12-15 response curves, got one that looks like Your's of Christian's. This is despite the fact I've increased the exposure of both reference A star and flat; almost hitting 60K adu in medium stretch as seen in Maxim DL's stretch window. Isis is very powerful, but very hard to get results you Pros have gotten without doing the processing for each pair (reference star/object) about 10X on each of the steps that Christian summerized in his wonderful, but brief tutorial.
I guess I'll have to put a couple of hundred more hours to replicate the results you typically see in ARAS forum. I wont even attempt high resolution until I can do the LISA spectra reductions! The IR kit will sit in its box until deep in the Summertime until I can overcome these software difficulties!
James
Thanks for the screen prints.....in my case...using huge Smooth coefficients makes the response curve look better.
To: Robin,
All my response curves look like Paul's or worse; mostly way worse. Seems all my respose curves turn-out like straight vertical lines unless I crop. If I crop too much into the UV (say shortward of 3800A) the curves stay vertical lines! More recently I've gotten a response curves that causes the reference A-star spectrum to be perfectly shaped to the Miles, but it ends up either above or below the reference star's process spectrum; see this example of a A3V star SAO84281, next to R & T CrB:
I have never yet, after processing 12-15 response curves, got one that looks like Your's of Christian's. This is despite the fact I've increased the exposure of both reference A star and flat; almost hitting 60K adu in medium stretch as seen in Maxim DL's stretch window. Isis is very powerful, but very hard to get results you Pros have gotten without doing the processing for each pair (reference star/object) about 10X on each of the steps that Christian summerized in his wonderful, but brief tutorial.
I guess I'll have to put a couple of hundred more hours to replicate the results you typically see in ARAS forum. I wont even attempt high resolution until I can do the LISA spectra reductions! The IR kit will sit in its box until deep in the Summertime until I can overcome these software difficulties!
James
James Foster
eShel2-Zwo ASI6200MM Pro
Lhires III (2400/1800/600 ln/mm Grat) Spectroscope
LISA IR/Visual Spectroscope (IR Configured)
Alpy 200/600 with Guide/Calibration modules and Photometric slit
Star Analyzer 200
eShel2-Zwo ASI6200MM Pro
Lhires III (2400/1800/600 ln/mm Grat) Spectroscope
LISA IR/Visual Spectroscope (IR Configured)
Alpy 200/600 with Guide/Calibration modules and Photometric slit
Star Analyzer 200
-
Andrew Smith
- Posts: 321
- Joined: Fri Sep 30, 2011 12:23 pm
Re: Isis processing issues
James, is it something simple like you have the spectra on the CCD so that there are regions at the UV (and/or IR) end with no signal. If you don't crop these regions off before trying to create an instrument profile you can get very strange outcomes.
Regards Andrew
Regards Andrew
-
James Foster
- Posts: 439
- Joined: Sun Jan 24, 2016 7:14 am
Re: Isis processing issues
To: Andrew,
RE:"...is it something simple like you have the spectra on the CCD so that there are regions at the UV (and/or IR) end with no signal. If you don't crop these regions off...."
That wasn't the problem; btw, unless I crop every response reduced image all I see of the calibrated spectra profile are vertical lines!....thx btw!
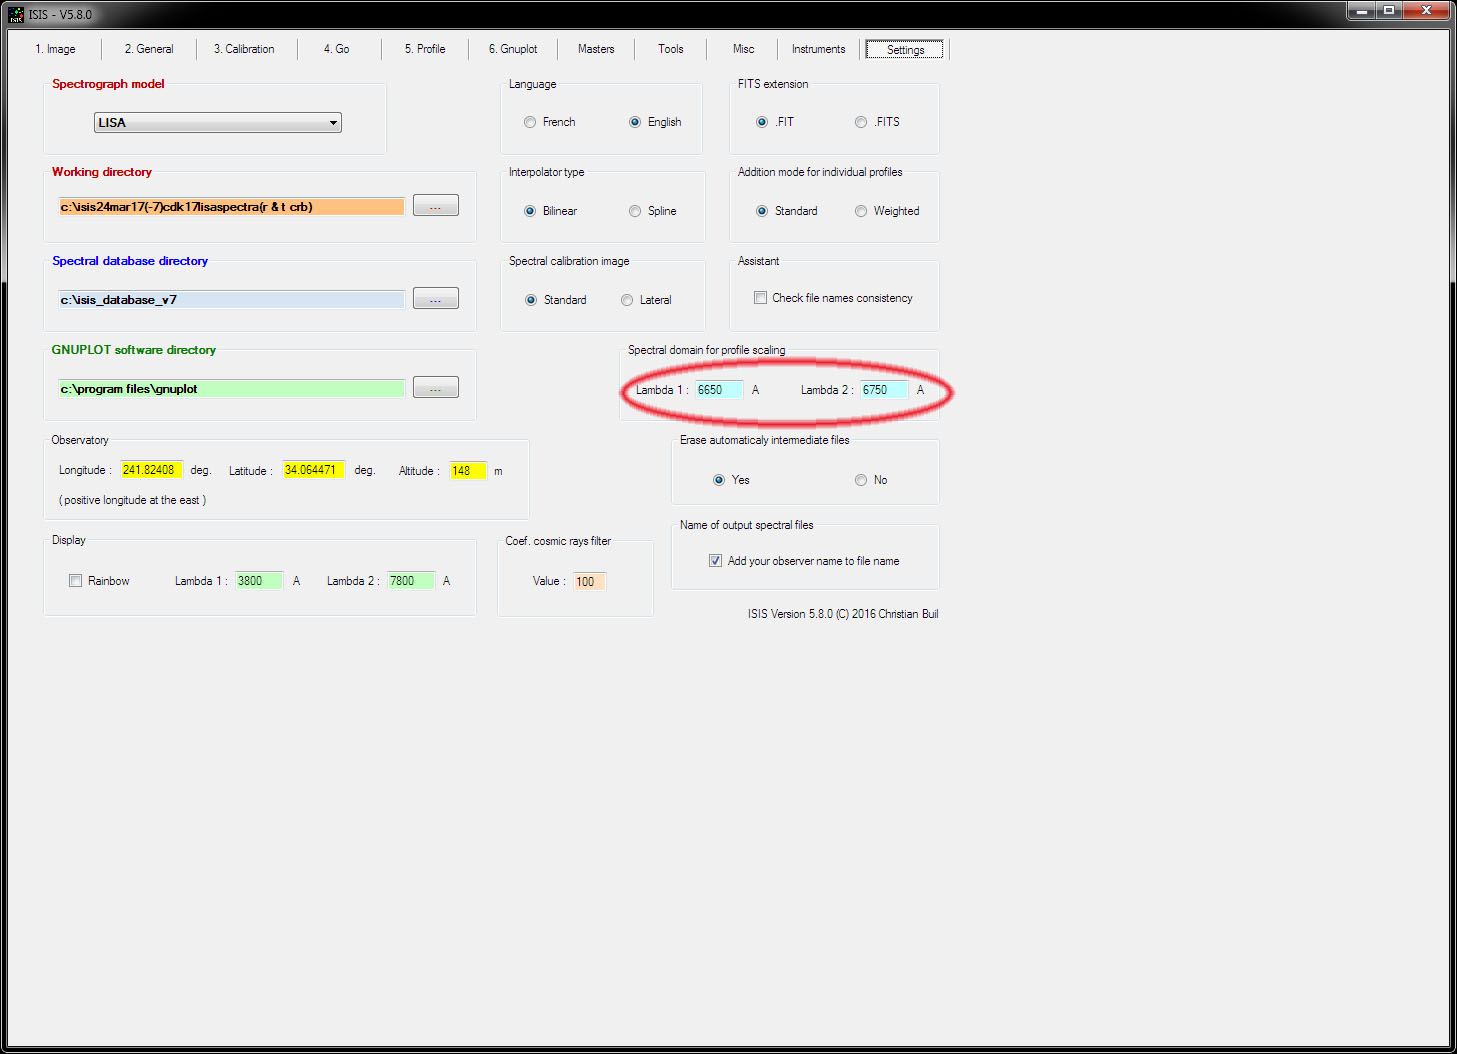
I accidentally changed the scaling profile spectral region to 3800-7600 in the Settings tab. Once I changed it to the screen print shown below, the A-star spectra lined up perfectly to the miles catalog spectra; see:
and
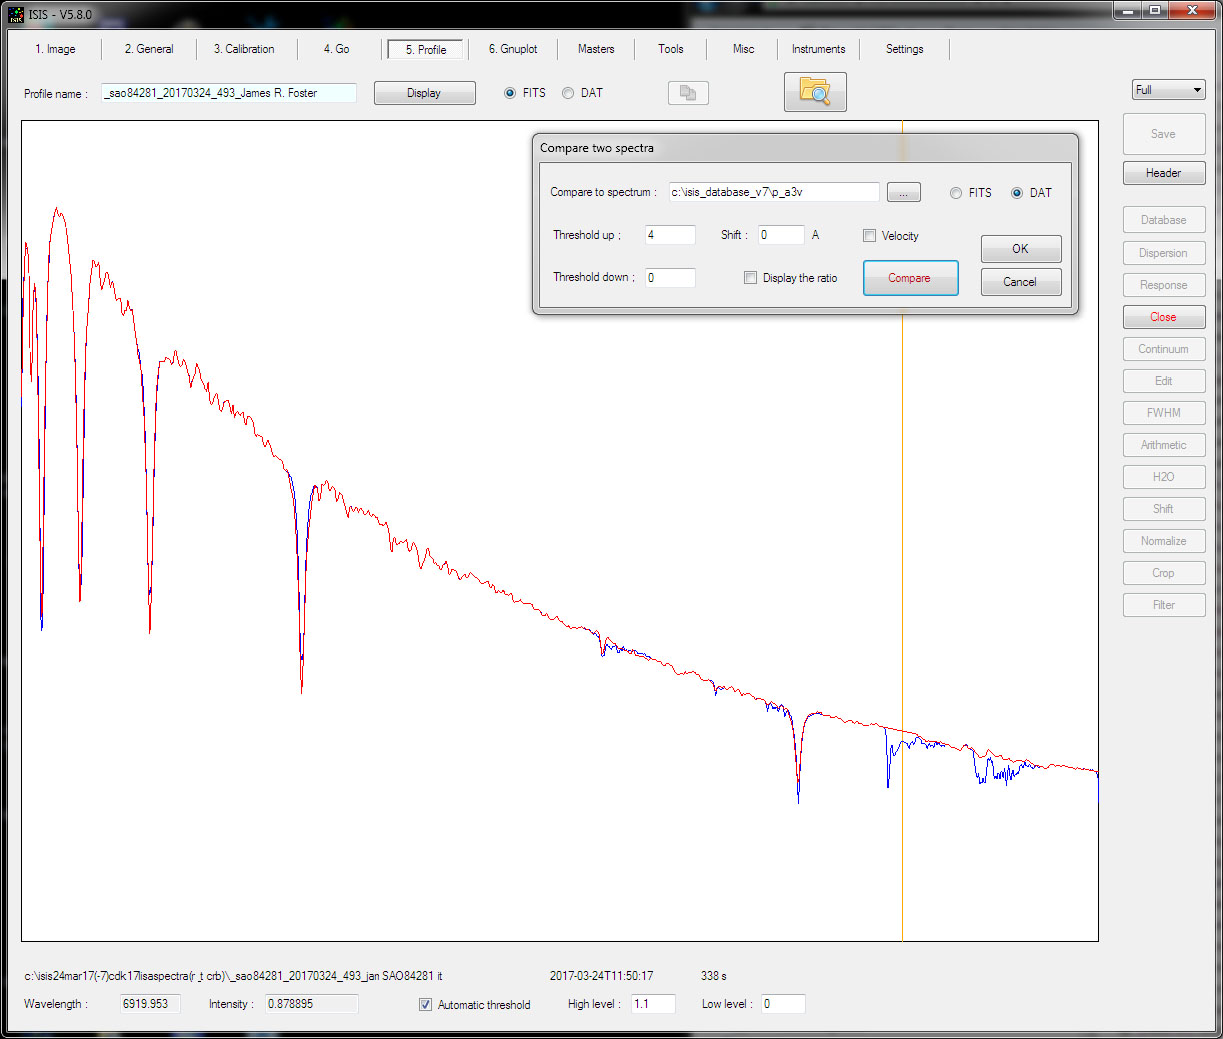
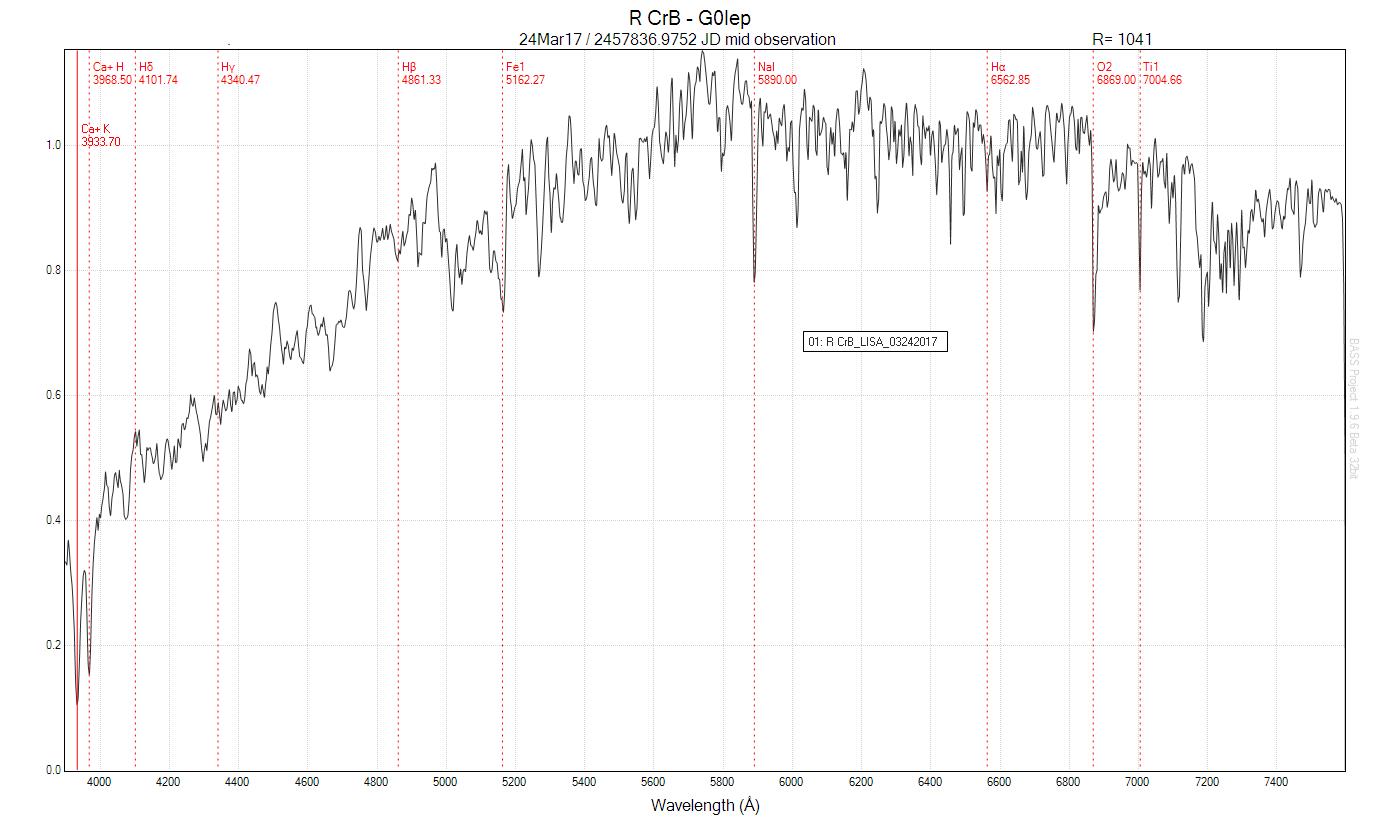
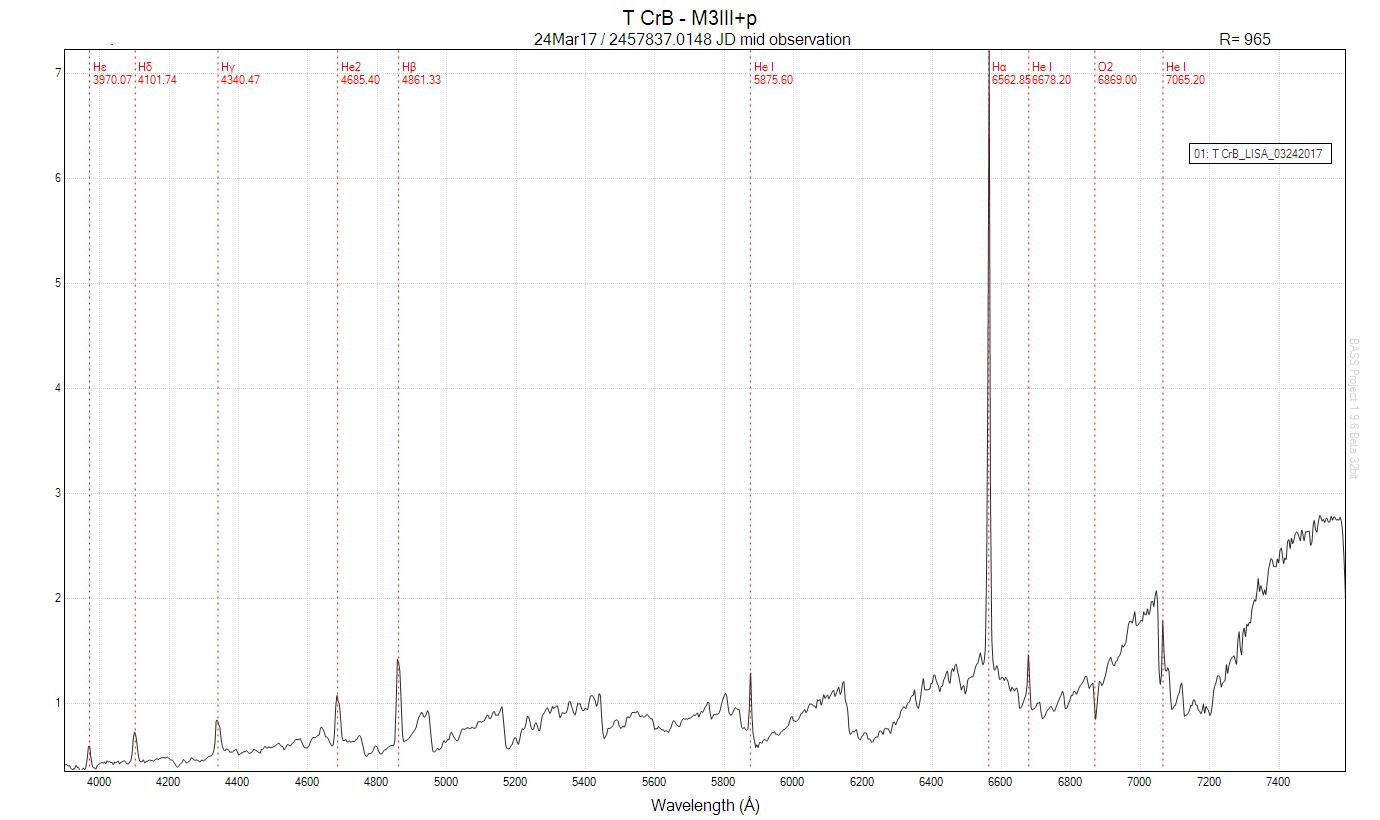
After this arduous exercise, I had confidence enough to process my R & T CrB spectra. This A3V star SAO84281 lies a little closer to R CrB than T CrB, so the R value is better; see:
and
Hope things go more smoothly now....still have 2-3 dozen spectra to process with each object going into its own directory to rename and re-process flats!...way more work
than corrected transformation photometry. (still enjoy it in a scientific-masochistic way)!
Its sort of "miraculous" how the emission/absorption" lines line-up with the elemental values.....Isis makes very clean spectra if you have the patience and time to play with it and experiment....still long way to go before I understand all its idiosyncrasies and input spectral exposures (neons/darks, flats, etc).
James
RE:"...is it something simple like you have the spectra on the CCD so that there are regions at the UV (and/or IR) end with no signal. If you don't crop these regions off...."
That wasn't the problem; btw, unless I crop every response reduced image all I see of the calibrated spectra profile are vertical lines!....thx btw!
I accidentally changed the scaling profile spectral region to 3800-7600 in the Settings tab. Once I changed it to the screen print shown below, the A-star spectra lined up perfectly to the miles catalog spectra; see:
and
After this arduous exercise, I had confidence enough to process my R & T CrB spectra. This A3V star SAO84281 lies a little closer to R CrB than T CrB, so the R value is better; see:
and
Hope things go more smoothly now....still have 2-3 dozen spectra to process with each object going into its own directory to rename and re-process flats!...way more work
than corrected transformation photometry. (still enjoy it in a scientific-masochistic way)!
Its sort of "miraculous" how the emission/absorption" lines line-up with the elemental values.....Isis makes very clean spectra if you have the patience and time to play with it and experiment....still long way to go before I understand all its idiosyncrasies and input spectral exposures (neons/darks, flats, etc).
James
James Foster
eShel2-Zwo ASI6200MM Pro
Lhires III (2400/1800/600 ln/mm Grat) Spectroscope
LISA IR/Visual Spectroscope (IR Configured)
Alpy 200/600 with Guide/Calibration modules and Photometric slit
Star Analyzer 200
eShel2-Zwo ASI6200MM Pro
Lhires III (2400/1800/600 ln/mm Grat) Spectroscope
LISA IR/Visual Spectroscope (IR Configured)
Alpy 200/600 with Guide/Calibration modules and Photometric slit
Star Analyzer 200