LhiresIII Image Response Curves
Posted: Fri Sep 28, 2018 9:21 pm
Here is a graph showing the IR curves I got on Vega over a span of about a month at various elevations with my LhiresIII with a 1800 l/mm grating and
35 micron slit using the CDK17 inch scope at F/10.5 around the H-Alpha line. I was wondering if they seem fairly typical to what other folks here get.
The elevations (from the MaximDL fits header) are shown in the box on the right. My effective altitude above sea level is 148 meters.
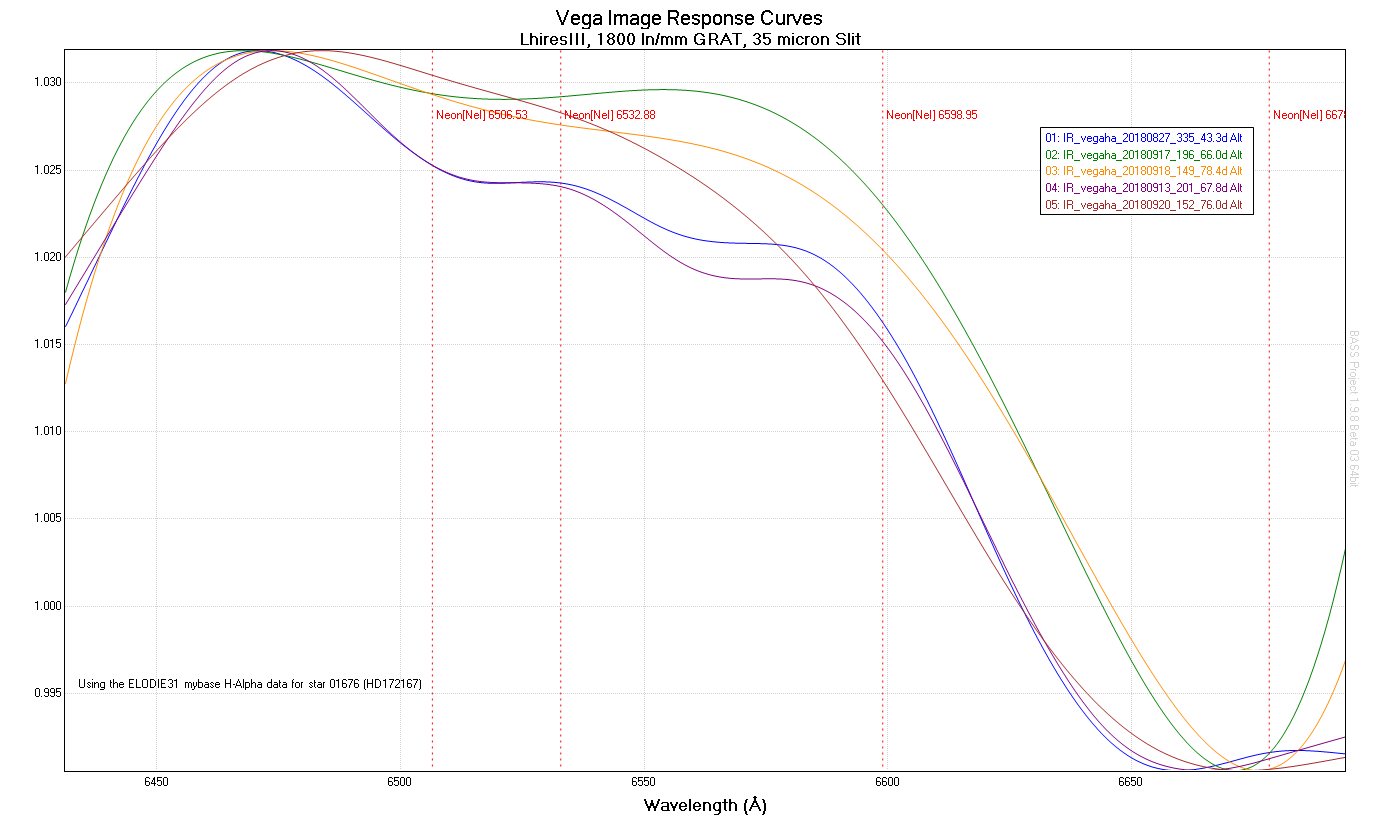
The curves were made from the A0V spectra in the Elodie database, cropped and normalized in Bassproject V1.98, and processed with Isis V5.1.92 on the calibrated Vega spectra using the four (4) neon emission lines shown in the graph. Let me know if you need any other processing details.
James
35 micron slit using the CDK17 inch scope at F/10.5 around the H-Alpha line. I was wondering if they seem fairly typical to what other folks here get.
The elevations (from the MaximDL fits header) are shown in the box on the right. My effective altitude above sea level is 148 meters.
The curves were made from the A0V spectra in the Elodie database, cropped and normalized in Bassproject V1.98, and processed with Isis V5.1.92 on the calibrated Vega spectra using the four (4) neon emission lines shown in the graph. Let me know if you need any other processing details.
James