VV Cep variability & frequency of observation

VV Cep 2017-2019 Campaign
Moderator for this forum: Ernst Pollmann
Olivier Thizy
Posts: 370
Joined: Sat Sep 24, 2011 10:52 am
Location: in the french Alps...
Contact:

VV Cep variability & frequency of observation

Post by Olivier Thizy »

Hello,


as VV Cep is a long term variable (20+ years), my intent was to get a spectrum every two weeks or so. But by comparing my last spectra, I realized that the Halpha emission was varying compared to the continuum:
VVCep comparison: 20150726 (Blue), 20150731 (Green) & 20150804 (Red)

Are those short term variations real (they seem on the spectra)?
Do they come from the Be star companion itself?


Cordialement,
Olivier Thizy
http://observatoire-belle-etoile.blogspot.fr/
Olivier Thizy
Posts: 370
Joined: Sat Sep 24, 2011 10:52 am
Location: in the french Alps...
Contact:

Re: VV Cep variability & frequency of observation

Post by Olivier Thizy »

Hello,


here is an interesting reply from Phil Bennett:
The variations are real, and come from the accretion region around the hot star. (The hot star itself is probably not variable).

The flux changes presumably are a result of changes in accretion onto the hot star. It would be interesting to see how quickly these changes occur, and also to see whether or not there is any periodicity.

In any case, I wouldn't be surprised to see changes from night to night, or even over a few hours.

The UV continuum at wavelengths shorter than 3700 A also shows a similar variability because it is coming from the same accretion source.

Phil Bennett

It seems it would be interesting to do a continuous observation of that star and see if we can spot any short timescale changes!


Cordialement,
Olivier Thizy
Ernst Pollmann
Posts: 461
Joined: Mon Sep 26, 2011 7:16 pm

Re: VV Cep variability & frequency of observation

Post by Ernst Pollmann »

Hi Olivier,
such intensity variations (sometimes by factor two or more) are to expect (see the attached Fig.). This corresponds to intrinsic light variation of the M star observed at 5080 Angstr. (Saito et al. 1980).
The study of the paper "A Spectroscopic Study of VV Cep during the 1976-78 Eclipse, Observation of the Halpha Line" by Kawabata & Saito 1981
(see my website http://astrospectroscopy.de/literatur.html ) provides a lot of interesting facts in this direction.

Ernst
Attachments
vvcep_Halpha.png
vvcep_Halpha.png (120.37 KiB) Viewed 8351 times
Olivier Thizy
Posts: 370
Joined: Sat Sep 24, 2011 10:52 am
Location: in the french Alps...
Contact:

Re: VV Cep variability & frequency of observation

Post by Olivier Thizy »

Hello,


thank you Ernst for the link/reference. We seem to have large variation in couple of days but I have noticed some very small variation over a 6h observation last night. I am not sure if this is noise or some signal from my instrument but it seems interesting to study further. Here is my spectrum (~6h exposure total) which I used as a baseline that was substracted to each individual spectra (Halpha only, but I can do the same for other wavelengths). I have 82 echelle spectra covering 4200-7350A in 23 different orders.

The 2D spectrogram done in ISIS does show some features:
VV Cep 2D Spectrogram 20150826.png

Cordialement,
Olivier Thizy
http://observatoire-belle-etoile.blogspot.fr/
Ernst Pollmann
Posts: 461
Joined: Mon Sep 26, 2011 7:16 pm

Re: VV Cep variability & frequency of observation

Post by Ernst Pollmann »

Olivier,
from my point of view, your measured Halpha intensity variations are no surprise.
Already Graczyk et al. (IBVS 4679) were able to determine a UBV period of 114 d during the time section 1991-1998, which have been connected with semiregular pusations of the M supergiant, and a corresponding mass transfer between both components.
Because this mass transfer is in the best way observably in the Halpha emission, your constant observation facility provides the great chance, to monitor the emission intensity for a long time out of the eclipse.

Possibly you can detect a correlation between short-term intensity variations (or any other periodicities as Phil already mentioned) and the pulsation period of the M star. But as I mentioned in my posting from August 23th (at Halpha Observation), this sort of mass exchange seems to be (or should be) of stochastic character.

Ernst
Peter Somogyi
Posts: 420
Joined: Sun Jul 13, 2014 8:56 am

Re: VV Cep variability & frequency of observation

Post by Peter Somogyi »

Sunday night I've made a 89 x 3 minute experiment:
vvcep_table_psomogyi.png
Hardly, but I can see a few slanted lines, question what they are.
(Last row is just a median filtered version of the same above.)

I had to redo the processing after realized 'optimal binning' must be switched off in ISIS for such a small differences, as the final difference 2D spectrogram correlated exactly with the raw spectrum line thickness!
No helocentric correction done, just "wavelength registration" what I've applied here (approx. 4 pixels skew corrected, linearily moved during this 4.5 hours). ISIS corrected a max of -0.134A instrumental shift.
Difference on the 2D (column averages substracted) spectrogram is +/- 0.025 (relatively to the 5.0 max), so no doubt we can meet with artifacts.
Used IRAF for the 2D synthesis (scopy ...) and column mean substraction, then Gimp for applying 2x shrink of width. Linearity kept.

Bigger view of first (pro1) and last (pro89):
vvcep_first_and_last.png
Cheers,
Peter
Peter Somogyi
Posts: 420
Joined: Sun Jul 13, 2014 8:56 am

Re: VV Cep variability & frequency of observation

Post by Peter Somogyi »

Hello,

As a sleeper project, I've left my scope on VV Cep searching for short-term variability.
No real change, just publishing for confirming it and reporting the actual state.

H-beta series (20 x 600 sec):
vvcep_hbeta_r1000_20x600s.png
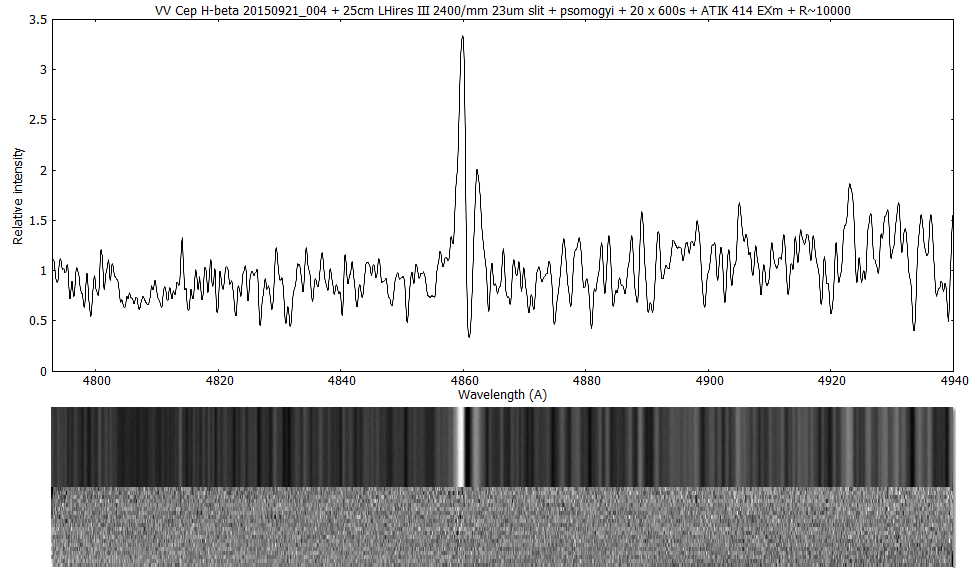
vvcep_hbeta_r1000_20x600s.png (84.32 KiB) Viewed 8173 times
I don't think this noise was coming from camera (even 1 x 600s was quite noiseless), it might be some kind of scattering in the blue I always see.

Blue-end experiment:
vvcep_blueend_R1900_20150906txt.png
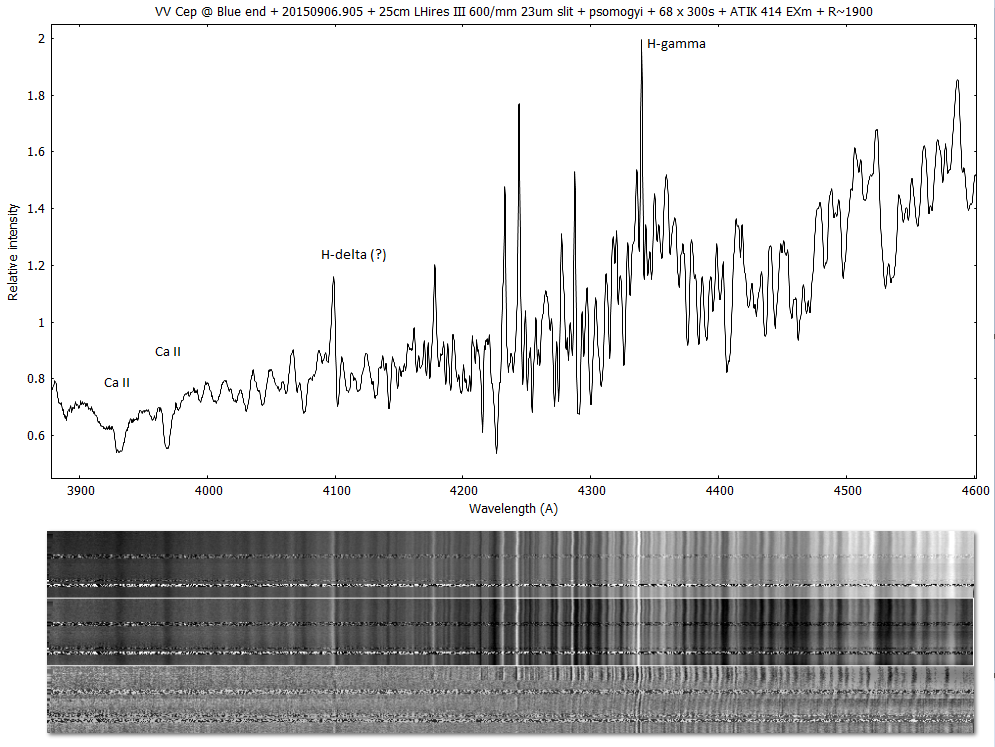
vvcep_blueend_R1900_20150906txt.png (224.41 KiB) Viewed 8173 times
I was able to focus only the middle 1/3rd part.
The 3 time-diagrams show following manipulation steps in 2D:
- original (min/max cut, linear, contains the wavelength registration shift at leftmost side)
- 2D polynom removal for the 2nd image (imsurfit 3, 5)
- column mean removal
Time is increasing from botton to top in all the above diagrams.

I think the faint changes near H-delta might be real (unsure if that big emission was really H-delta at this resolution), other variations on the right side must be just artifacts of wavelength fitting problems.

I couldn't move to UV with this 600/mm grating mostly because of scattering light on the flat problems (not just becase focusable area is only 1/3rd).
My experiment with the Orion G3 camera taking out the glass produced at least better UV flat without light scattering - but then couldn't cool it (dew problems, tried) which means can't use for such a low light.

As for a mid-term change, after a few weeks (H-alpha):
vvcep_halpha_r17K_20150830_0920.png
Cheers,
Peter

EDIT: the 2 horizontal noise rows in the blue-end 2D series are of course: clouds.
Ernst Pollmann
Posts: 461
Joined: Mon Sep 26, 2011 7:16 pm

Re: VV Cep variability & frequency of observation

Post by Ernst Pollmann »

Hi Peter,
it's not easy to interpret the different variability you measured in your different wavelength areas. But concerning short-term variations, you should think about the constantly mass transfer from the super giant into the accretion disk of the B star (inspite of the large orbital eccentricity of 0.37)
The strong scattering of the Halpha-EW outside the eclipse (see: "Halpha observation" this sub forum) seems to be an indicator for corresponding intensity variations you could expect any time within the entire spectrum.

Ernst
Peter Somogyi
Posts: 420
Joined: Sun Jul 13, 2014 8:56 am

Re: VV Cep variability & frequency of observation

Post by Peter Somogyi »

Hi Ernst,

Thank you for the look, yes the EW(H-alpha) looks varying here a bit.
And on the H-beta and blue-end, mostly just Balmer lines showing anything.

Peter
Olivier GARDE
Posts: 1244
Joined: Thu Sep 29, 2011 6:35 am
Location: Rhône Alpes FRANCE
Contact:

Re: VV Cep variability & frequency of observation

Post by Olivier GARDE »

VV Cep evolution from september 2015 to january 2016.

Yesterday, I took some spectra of VV Cep with my eshel spectrograph.
Image

And comparaison from september 2015 to January 2016
For H-Alpha
Image
For H-Beta
Image
For H-Gamma
Image
LHIRES III #5, LISA, e-Shel, C14, RC400 Astrosib, AP1600
http://o.garde.free.fr/astro/Spectro1/Bienvenue.html
Post Reply