Lhires III spectrograph was ready to operate after a set up performed during daylight time with Sun (filtered) and distant terrestrial object. I put vertical slit to include entire false nucleus image stretched by strong atmospheric differential refraction and also to analyze comet tail.
We take 7 x 60 sec frames in sequence with the comet out of any clouds. In this poster you find the summary of observations:
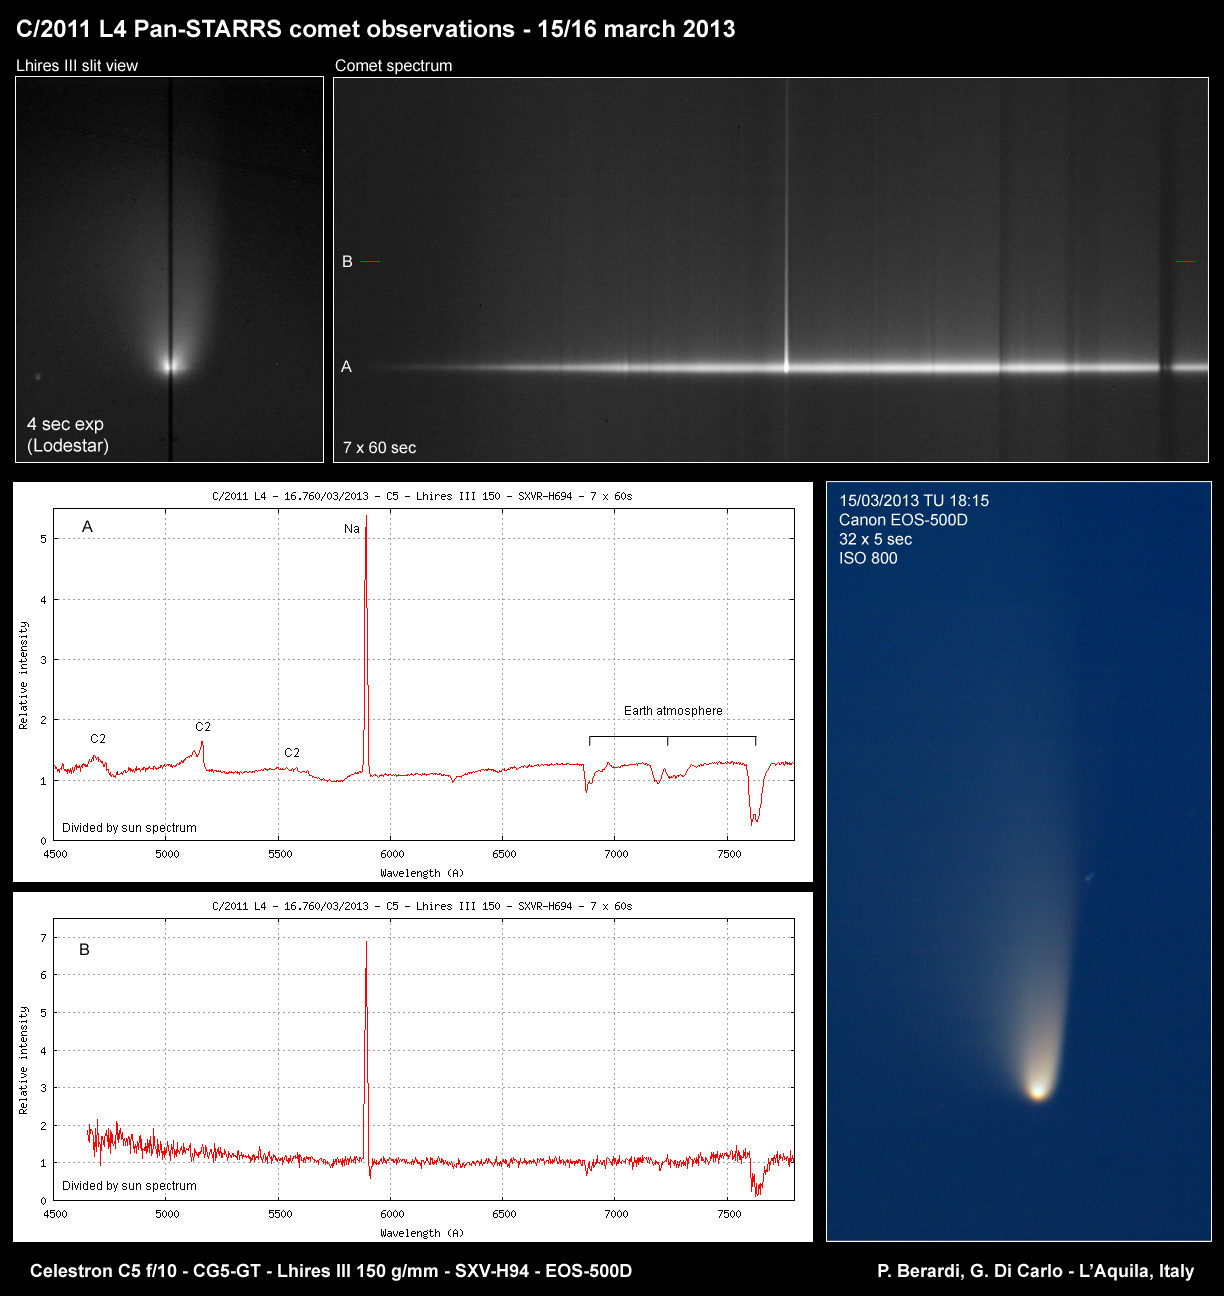
Remarkable the strong sodium emission in false nucleus, coma and tail, in relation to a faint C2 Swan bands emission. We do not capture CN at 3880A but I don't know if it depends on very strong extinction in violet range for very low target altitude (and some out of focus for doublet chromatic aberration). There is also a slight absorption immediately to the right (red side) of Na emission in coma-tail transition (appreciable in B profile) that I cannot explain as instrumental defect or reduction artifact (it is visible in the individual raw frames).
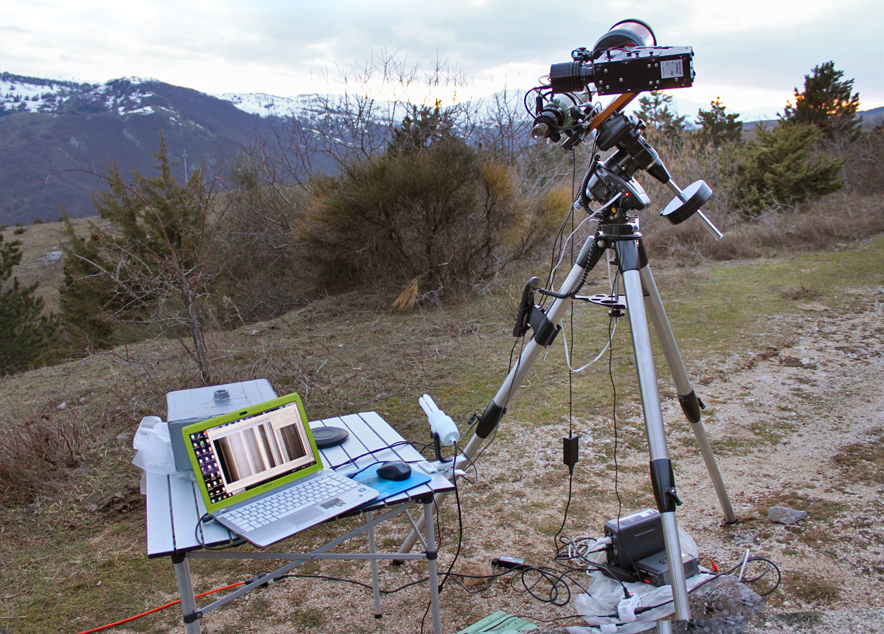
Working with setup at Gran Sasso mountain site (Apennines):
At the time of capturing, comet was 5.3 degree above the true horizon. To divide correctly observed spectrum for the solar spectrum we should have to observe Moon or a G2V star at similar altitude. Unfortunately clouds did not allow it but I was able to capure spectrum of Moon in a short time it was in clear sky, when positioned at 37 degree above horizon.
With these data I tried to calculate division by sun spectra showed in poster with the following method. I hope not to be wrong, in case please let me know.
Considering elevation site (1170 meters asl) and Aerosol Optical Depth equal to 0.05, I obtain atmospheric transmission curve for both comet and Moon altitude (thanks to Christian for dedicated web page "Le calcul de la transmission spectrale atmosphérique").
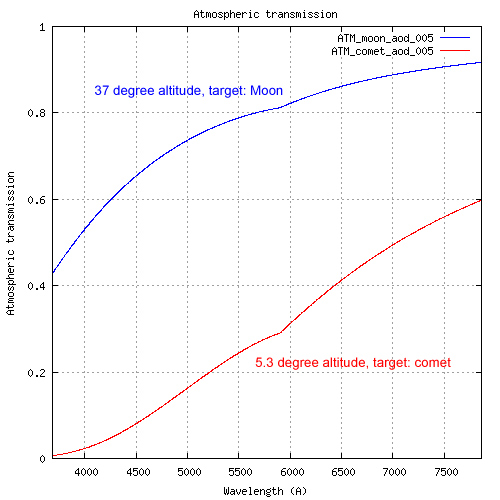
I divide red transmission curve by blu curve obtaining a transmission ratio. Then I multiplied observed Moon spectrum for the ratio curve. The result should be the "reddened" Moon spectrum, that is the spectrum we observed if the Moon was at the elevation of comet (apart telluric absorption).
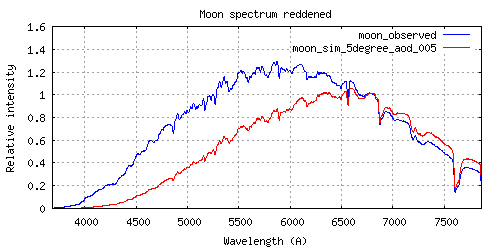
Finally, the spectrum of the comet has been divided by the last result, obtaining the profile showed in poster. Telluric bands remain because effective depth is quite different at 5 or 37 degree altitude.
Ciao
Paolo