Hi Ernst,
Really interesting development. I know we emailed a bit about this, so hopefully you don't mind me posting here too.
Hydrodynamical models predict that binary-induced disk oscillations produce m = 2 density waves, illustrated in this plot:
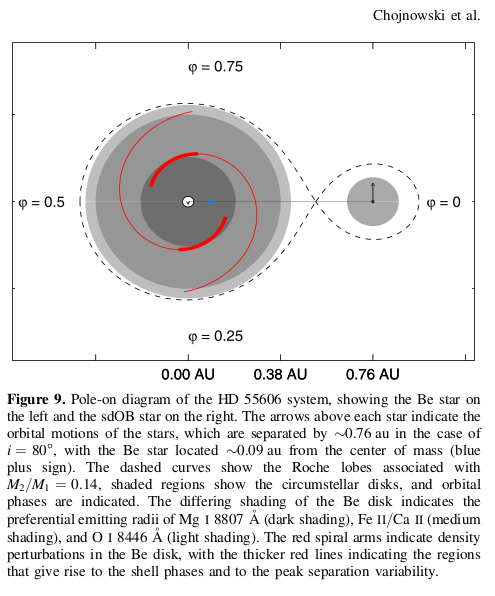
- Chojnowski_et-al_2018.png (74.98 KiB) Viewed 51735 times
Fig. from 2018ApJ...865...76C
In this case of m = 2 density waves, there are two 'arms' of overdense regions in the disk (and, between these, regions of underdensity). As we observe this pattern to evolve over the orbital period, we should see features that are double-waved at P_orb. Or, put another way, things like the V/R ratio have a dominant signal at
half the orbital period.
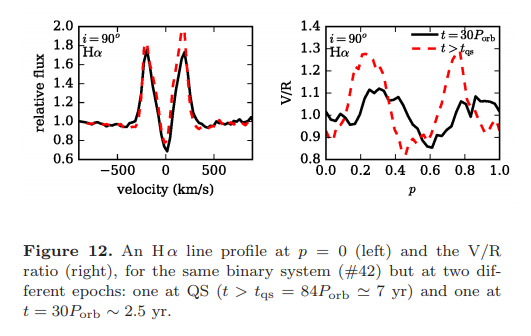
- Panoglou_et-al_2019_Ha_VonR.png (64.28 KiB) Viewed 51735 times
Fig. from 2018MNRAS.473.3039P
So, I believe that's what we're seeing with pi Aqr here- an m = 2 density wave with both arms of near-equal strength.
On the other hand, sometimes binary-induced density waves are still m = 2 (and two-armed), but one arm is much stronger than the other. When this happens, things like V/R have a dominant signal at the orbital period. This is what is seen, for example, in HD 55606: V/R ratios show a sinusoid at P_orb (so probably one of the two arms is much stronger).
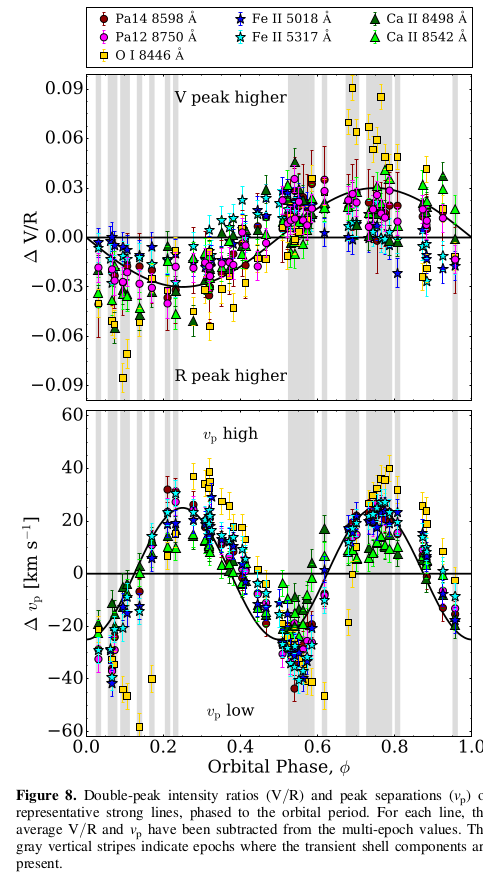
- Chojnowski_et-al_2018_fig8.png (151.74 KiB) Viewed 51735 times
Fig. from 2018ApJ...865...76C
For pi Aqr then, it seems like the density wave has evolved from having one dominant arm (when P_V/R = P_orb) to now having two arms of equal strength (where now P_V/R = 0.5 * P_orb). It is interesting to note that this transition seems to be happening as the disk is increasing in strength, as seen from the evolution of EW or E/C of Halpha. Also, at the same time, it seems as though a slower m = 1 oscillation is growing, seen in the relatively gradual increase of Ha V/R as plotted by Ernst above in the red circled region after JD = 2459000.
At any rate, I certainly agree this continues to be an interesting system to observe.