Hello,
Steve Shore sent for all of us a very interesting explanation on what is happening with the nova Del 2013.
He clearly encourages all of us to continue to observe this nova and to increase time zone coverage (US Time zone but also Australia Time zone). Please observe with different resolution and in different wavelengths, at least the 4000-4400 A and 4900 -6000 A range, and of course H-alpha. This will allow a comparison of the Fe, He, CN, Balmer, O and N lines.
Cordialement,
Olivier Thizy
Vous ne verrez plus des étoiles comme avant !
http://www.shelyak.com/en/
---------------
The last spectra are showing what HAS to happen, Olivier, please
encourage everyone to keep banging away. Let me explain, I'll try to
keep these notes coming if people find them useful (and I hope not too
long-winded).
steve
---------------
At the start of the expansion, at least when we see the nova visibly,
the ejecta should pass through a stage called the fireball. This is an
opaque stage that resembles a single expanding surface, or a sort of
thin atmosphere, with an almost uniform temperature. Usually that
isn't observed but in this nova it might have been caught. The
expansion velocity is high enough that the matter can't radiate
efficiently enough to cool by energy loss, the temperature drops
instead because of the increasing volume at constant mass -- he energy
density is dropping. This is the same as saying that the total energy
remains almost constant but the temperature decreases. Then something
important happens. When the matter gets cool enough, first the
hydrogen and then heavier elements start to recombine. This releases
some energy (from the excess energy of the electrons as they're
captured by the ions) but mainly that the neutral and low ionization
stages have much higher line (and continuum) opacities and the
absorption in the ultraviolet increases quickly. The lines that absorb
there are the ground state transitions; that is, they're the strong
zero volt states. Their upper levels are those that both pump the
absorption strength of the optical transitions and excite the levels to
reradiate. So the Fe II spectrum, for instance, suddenly starts to
appear. There are coincidences with some of the He I lines, e.g. He I
5016 is close to Fe II 5018, the same for He I 4923 being near an Fe II
line (in these cases they're both from the same lower level). The
lack, in the last spectra, of He I 5875 gives the game away: the
triplet series (He I 7065, 5875, 4471) being absent means the stuff at
the near-coincidences if Fe II (and other heavy ions). In the Ondrejov
spectra, we have Ca I 4226 yesterday suddenly making an entry. At the
same time Ca II showed a higher velocity absorption than the H-beta
line. So the ejecta seem to be showing some depth structure now.
What all this means is that we're watching a stage in a classical nova
that hasn't been covered since photographic series on DQ Her, the last
nova that was bright enough for such coverage in the modern era,
although DN Gem and CP Pup were also well covered (but not like what
all of you have produced!) As I've already written, we're in new
territory here -- between observational capabilities and opportunities
to catch individual events -- so it's important that you keep up your
courage and bang away. It is possible that within the next week there
'll be a shortlived absorption stage in CN 4216 (and also 3883). In
the IR there should be a CO 2 micron emission stage. If the nova isn't
a DQ Her type, then we really have no analog.
The continuing fluctuations in the photometry, also known from other
novae at maximum light, remain a very deep problem and, again, any
observations with the highest possible cadence (this also means
longitude coverage from all of you to get the most continuous
sequences) will be critical. For instance, the disappearance of the He
I corresponded to a "local" peak in the optical light, this could be a
recombination event or it could be multiple ejections. To speculate,
so early, is too risky (even for a theorist!) so I'll stop now and hope
this explains the stages you're seeing.
One more point, though. The recession of the absorption velocity is
something also known from the DQ Her outburst, this is an effect of
the change in the transparency of the ejecta. If this is the effect of
seeing deeper into the layers at first during the late fireball, then
it should reverse as he recombination sets in and the ejecta cool.
_
Steve Shore
PNV J20233073+2046041 mag 6.8
-
Olivier Thizy
- Posts: 370
- Joined: Sat Sep 24, 2011 10:52 am
- Location: in the french Alps...
- Contact:
-
Olivier GARDE
- Posts: 1276
- Joined: Thu Sep 29, 2011 6:35 am
- Location: Rhône Alpes FRANCE
- Contact:
Re: PNV J20233073+2046041 mag 6.8
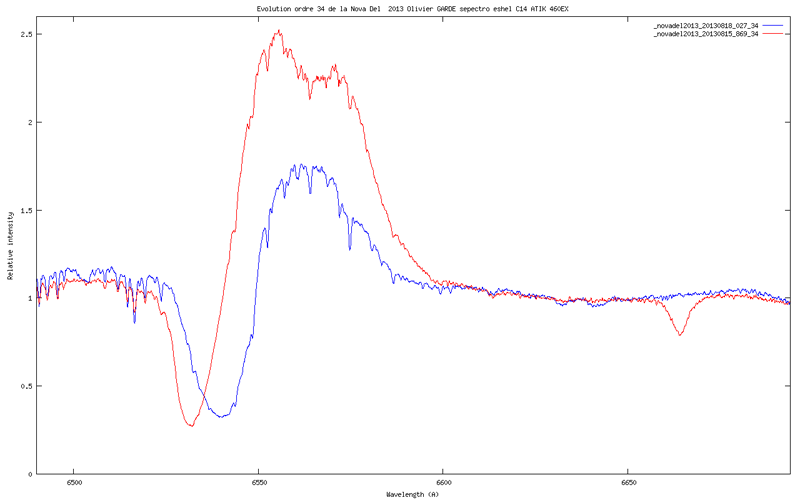
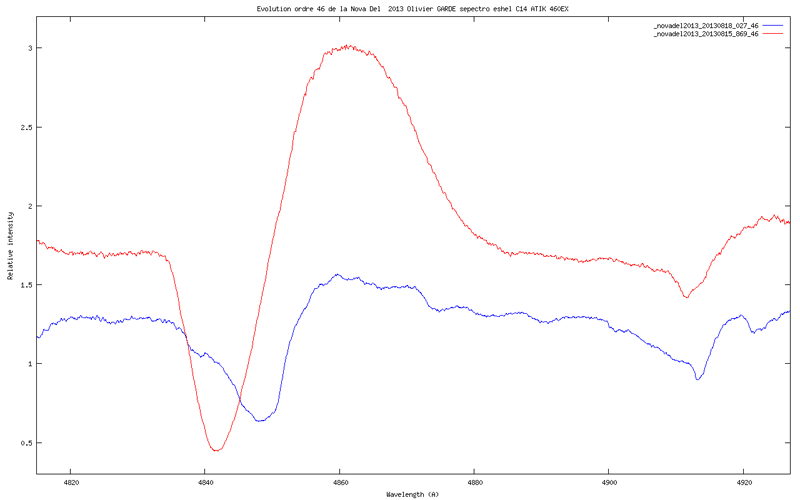
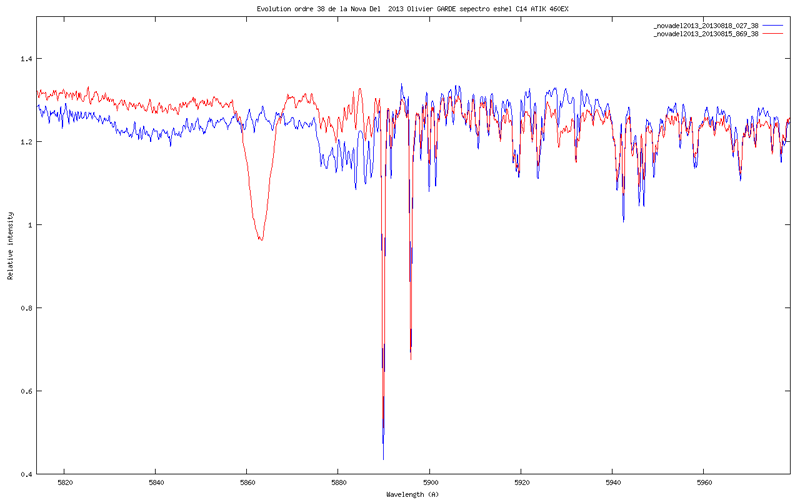
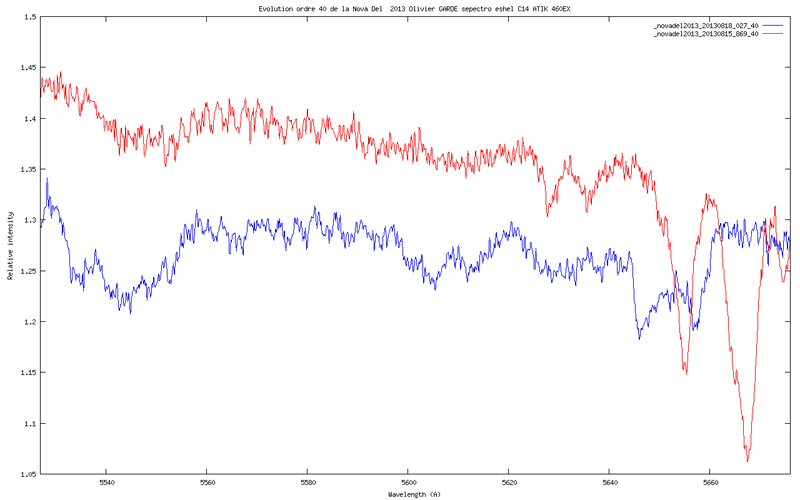
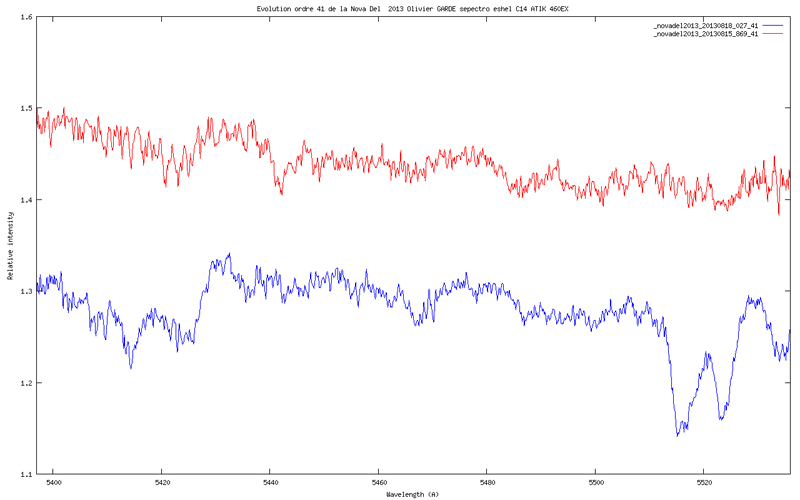
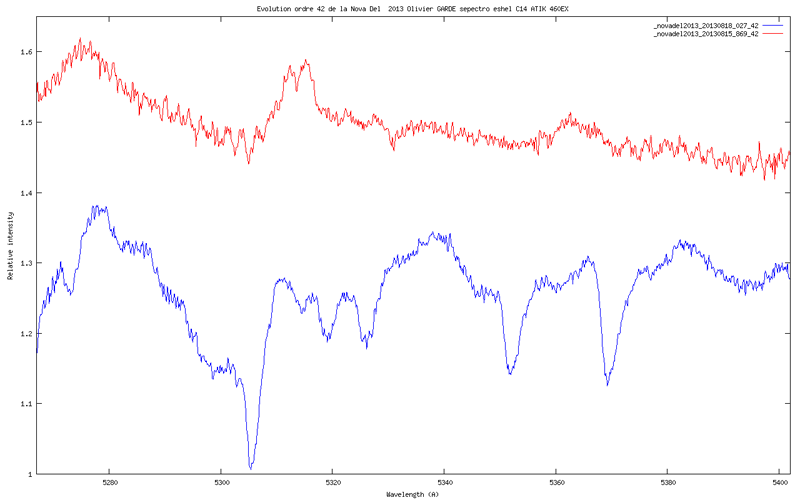
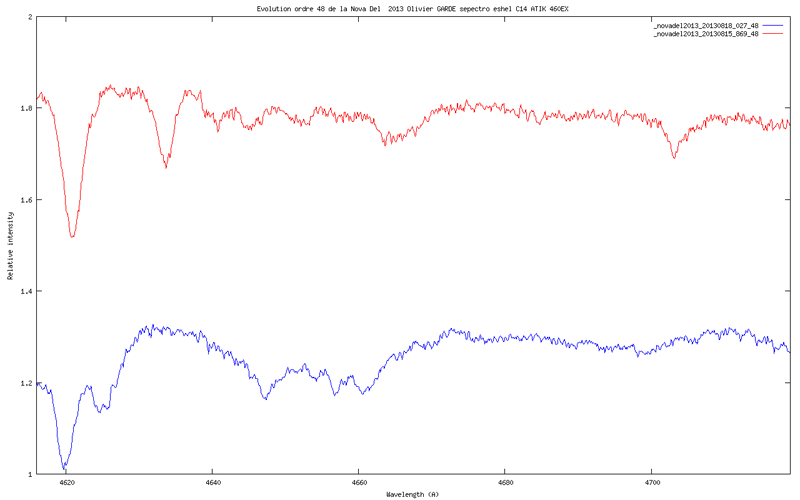
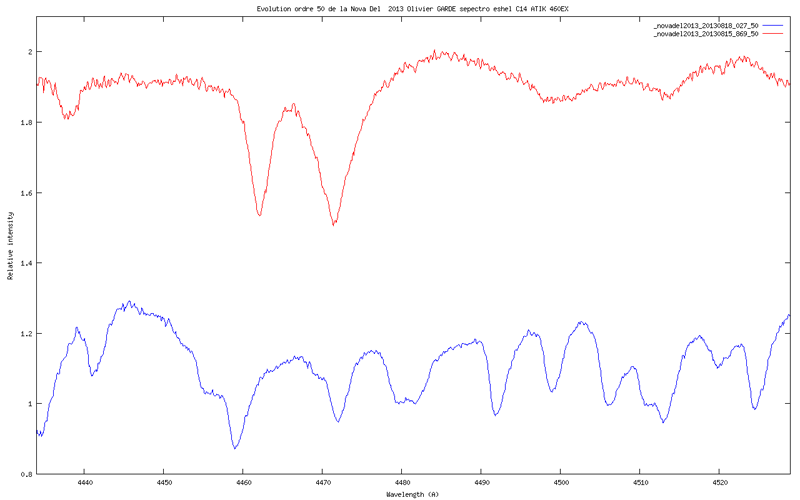
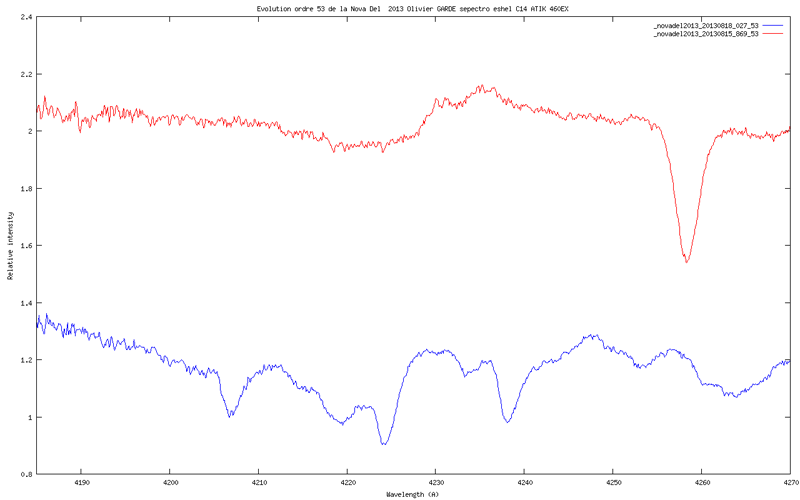
There're many lines mooving on the spectra from the 15th to the 18th
Here's the main change of some order of the eshel spectrograph
The red curve, the spectra taken the 15th August
The blue curve, the spectra taken the 18th august
Si l'on compare les spectres du 15 Août avec ceux du 18 août, il y a pas mal d'évolution sur certaines parties du spectre
J'ai sélectionné certains ordres ou les changements sont les plus marqués.
La courbe rouge, les spectres acquis le 15 août
La courber bleue, les spectres acquis le 18 août
Ha order
Hb order
order 38 (from 5814 Å to 5979 Å)
order 40 (from 5527 Å to 5676 Å)
order 41 (from 5397 Å to 5536 Å)
order 42 (from 5267 Å to 5402 Å)
order 48 (from 4616 Å to 4719 Å)
order 50 (from 4434 Å to 4529 Å)
order 53 (from 4185 Å to 4270 Å)
LHIRES III #5, LISA, e-Shel, C14, RC400 Astrosib, AP1600
http://o.garde.free.fr/astro/Spectro1/Bienvenue.html
http://o.garde.free.fr/astro/Spectro1/Bienvenue.html
-
Terry Bohlsen
- Posts: 191
- Joined: Thu Sep 29, 2011 7:40 am
Re: PNV J20233073+2046041 mag 6.8
My follow up spectra from tonight. I have had poor weather for the last 2 days so this was the first chance to take a spectra since 15th.
Cheers
Terry


Cheers
Terry
Terry Bohlsen
Armidale NSW
Australia
Armidale NSW
Australia
-
Andre Favaro
- Posts: 9
- Joined: Sat Mar 24, 2012 7:41 pm
Re: PNV J20233073+2046041 mag 6.8
A high resolution spectrum from last night.
andré
andré
- Attachments
-
- _del2013_20130817_899_afavaro.jpg (49.68 KiB) Viewed 46719 times
-
Olivier Thizy
- Posts: 370
- Joined: Sat Sep 24, 2011 10:52 am
- Location: in the french Alps...
- Contact:
Re: PNV J20233073+2046041 mag 6.8
[quote="Terry Bohlsen"]My follow up spectra from tonight. I have had poor weather for the last 2 days so this was the first chance to take a spectra since 15th.
Cheers
Terry
Terry,
well done - it is great to haveyou observing in that time zone... keep up!
Cordialement,
Olivier
Cheers
Terry
Terry,
well done - it is great to haveyou observing in that time zone... keep up!
Cordialement,
Olivier
Olivier Thizy
https://observatoire-belle-etoile.blogspot.fr/
https://observatoire-belle-etoile.blogspot.fr/
-
Olivier Thizy
- Posts: 370
- Joined: Sat Sep 24, 2011 10:52 am
- Location: in the french Alps...
- Contact:
Re: PNV J20233073+2046041 mag 6.8
Andre Favaro wrote:A high resolution spectrum from last night.
andré
André,
well done. Looking forward to see your spectrum in ARAS database...
Cordialement,
Olivier
Olivier Thizy
https://observatoire-belle-etoile.blogspot.fr/
https://observatoire-belle-etoile.blogspot.fr/
-
Keith Graham
- Posts: 128
- Joined: Thu Sep 29, 2011 6:20 pm
Re: PNV J20233073+2046041 mag 6.8
Hi All,
I see that all of the posted spectra have annotations showing the spectrum label at the top, dates the spectra were taken at the upper right of the spectrum, and X and Y axis labels. Since most (or all) submitted spectra have this information, I assume there is something I am missing in either Vspec or ISIS that produces this final product. Would someone please tell me how this is done? I currently simply copy the spectrum from Vspec into Word to get a printout, but there is no information on the spectrum other than the wavelength and intensity values.
Also, I assume that once I get this final annotated spectrum that I simply upload it as an attachment when submitting it to this ARAS forum – is that correct?
Thanks,
Keith
-
Olivier GARDE
- Posts: 1276
- Joined: Thu Sep 29, 2011 6:35 am
- Location: Rhône Alpes FRANCE
- Contact:
Re: PNV J20233073+2046041 mag 6.8
Hi Keith,Keith Graham wrote:Hi All,
I see that all of the posted spectra have annotations showing the spectrum label at the top, dates the spectra were taken at the upper right of the spectrum, and X and Y axis labels. Since most (or all) submitted spectra have this information, I assume there is something I am missing in either Vspec or ISIS that produces this final product. Would someone please tell me how this is done? I currently simply copy the spectrum from Vspec into Word to get a printout, but there is no information on the spectrum other than the wavelength and intensity values.
Also, I assume that once I get this final annotated spectrum that I simply upload it as an attachment when submitting it to this ARAS forum – is that correct?
Thanks,
Keith
For the graphical presentation of spectra you must install gnuplot, a freeware, and both software ISIS and Vspec use gnuplot for ploting curve with label.
On the ISIS or Vpsec web site, you will see how to install gnuplot to perform graph.
Olivier GARDE
Last edited by Olivier GARDE on Sun Aug 18, 2013 8:11 pm, edited 1 time in total.
LHIRES III #5, LISA, e-Shel, C14, RC400 Astrosib, AP1600
http://o.garde.free.fr/astro/Spectro1/Bienvenue.html
http://o.garde.free.fr/astro/Spectro1/Bienvenue.html
-
Olivier Thizy
- Posts: 370
- Joined: Sat Sep 24, 2011 10:52 am
- Location: in the french Alps...
- Contact:
Re: PNV J20233073+2046041 mag 6.8
Keith,
I use ISIS GnuPlot capability.
1/ get latest ISIS release with a special tab on GnuPlot
2/ install GnuPlot and ISIS specific scripts:
http://www.astrosurf.com/buil/isis/gnuplot/install.htm
3/ once you have your calibrated/reduced profile in ISIS, I copy/paste the file name into ISIS GnuPlot tab; for exemple:
This creates a PNG file in your working directotry with the graph.
Cordialement,
Olivier Thizy
Vous ne verrez plus des étoiles comme avant !
http://www.shelyak.com/en/
I use ISIS GnuPlot capability.
1/ get latest ISIS release with a special tab on GnuPlot
2/ install GnuPlot and ISIS specific scripts:
http://www.astrosurf.com/buil/isis/gnuplot/install.htm
3/ once you have your calibrated/reduced profile in ISIS, I copy/paste the file name into ISIS GnuPlot tab; for exemple:
- Capture.JPG (54.13 KiB) Viewed 46683 times
Cordialement,
Olivier Thizy
Vous ne verrez plus des étoiles comme avant !
http://www.shelyak.com/en/
Olivier Thizy
https://observatoire-belle-etoile.blogspot.fr/
https://observatoire-belle-etoile.blogspot.fr/
-
Keith Graham
- Posts: 128
- Joined: Thu Sep 29, 2011 6:20 pm
Re: PNV J20233073+2046041 mag 6.8
Thanks a bunch for the information. I had not, as yet, gotten my feet wet with Gnuplot. It appears this would be a good time to do so.
Thanks again,
Keith
Thanks again,
Keith