v694 Mon
-
umberto sollecchia
- Posts: 247
- Joined: Tue Dec 30, 2014 3:25 pm
Re: v694 Mon
Bonjour à tous, un nouveau profil et l 'animation d'observation 03.08.2016.
Animation Salutations Umberto
Animation Salutations Umberto
-
umberto sollecchia
- Posts: 247
- Joined: Tue Dec 30, 2014 3:25 pm
Re: v694 Mon
Bonsoir à tous, le profil de ce soir.
salutations umberto
salutations umberto
-
Joan Guarro Flo
- Posts: 722
- Joined: Thu Nov 03, 2011 8:50 pm
Re: v694 Mon
Hi:
It is also a graph of last night, which complements that of the Umberto.
Regards, Joan.
It is also a graph of last night, which complements that of the Umberto.
Regards, Joan.
- Attachments
-
- _v694mon_20160311_791_J. Guarro.png (9.23 KiB) Viewed 11276 times
-
Paolo Berardi
- Posts: 578
- Joined: Thu Sep 29, 2011 10:51 pm
Re: v694 Mon
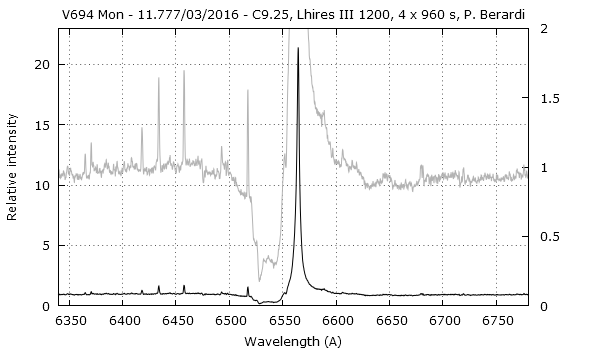
Hi Joan, Umberto and all. A mid-res spectrum for the same night (between many clouds...):

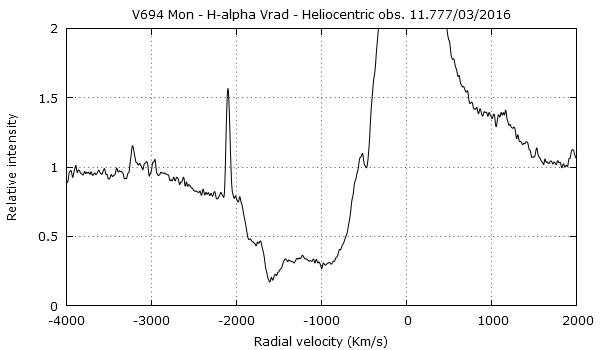
Plot of radial velocity:

It seems to me that maximum radial velocity has increased (~ -3000 Km/s).
Paolo

Plot of radial velocity:

It seems to me that maximum radial velocity has increased (~ -3000 Km/s).
Paolo
-
Francois Teyssier
- Posts: 1565
- Joined: Fri Sep 23, 2011 1:01 pm
- Location: Rouen
- Contact:
Re: v694 Mon
Excellent
Complex profile of the absorption
Clear sky today, for the first time in a long time.
I'll try it. Not easy for me, it's very low.
François
Complex profile of the absorption
Clear sky today, for the first time in a long time.
I'll try it. Not easy for me, it's very low.
François
François Teyssier
http://www.astronomie-amateur.fr
http://www.astronomie-amateur.fr
-
Joan Guarro Flo
- Posts: 722
- Joined: Thu Nov 03, 2011 8:50 pm
Re: v694 Mon
Ciao Paolo
E'un buon lavoro.
Saluti tanti, Joan.
E'un buon lavoro.
Saluti tanti, Joan.
-
Paolo Berardi
- Posts: 578
- Joined: Thu Sep 29, 2011 10:51 pm
Re: v694 Mon
Thank you François, Joan.
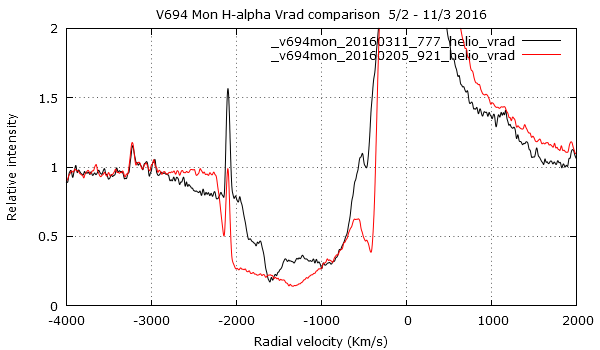
I add a H-Alpha Vrad comparison between 5 feb and 11 mar 2016.

Paolo
I add a H-Alpha Vrad comparison between 5 feb and 11 mar 2016.

Paolo
-
Peter Somogyi
- Posts: 420
- Joined: Sun Jul 13, 2014 8:56 am
Re: v694 Mon
Nice series for the lores full spectra, ideal for a real data mining!
Just for my curiosity I've compiled a LoRes serie of v694 Mon picked every day, to get an insight what is changing and how does ARAS correlate with AAVSO.
Hope authors don't mind to publish such a compilation (2016.01.20 - 2016.03.07): This is the way I produced this animated gif:
- downloaded 22 spectra from here one by one via normal http, trying to cover the most interesting AAVSO-reported peak around 2016-FEB-11/12:
http://www.astrosurf.com/aras/Aras_Data ... 694Mon.htm
(at this time 2016.03.07 is the last downloadable)
- created continuum for each spectra via IRAF task 'continuum' with params:
sampling region: 3700:4800,5000:5800,5900:6400,6700:7200, order: 9, function: legendre, iteration: 100 (rejects outstanding peaks/holes)
- then divided each spectra by their extracted continuum
- generated AAVSO chart from http://www.aavso.org
- used ImageMagick to put aavso + annotate AUTHORs noting resolution at the bottom of pictures (and a set of linux commands, all free and opensource)
- of course, all thandled with my local script ecosystem...which is a set of random script stanzas in bash + IRAF commands I have gathered in the last 4-5 years + now.
Hope others find the animation useful for gathering insight what is changing.
Happy hunting!
- Peter
-
Francois Teyssier
- Posts: 1565
- Joined: Fri Sep 23, 2011 1:01 pm
- Location: Rouen
- Contact:
Re: v694 Mon
After the episode "aquarium", the observatory works again.
François
François
François Teyssier
http://www.astronomie-amateur.fr
http://www.astronomie-amateur.fr
-
Jim Ferreira
- Posts: 8
- Joined: Sun Jan 27, 2013 9:42 pm
Re: v694 Mon
Hello
This is my first time posting to the forum....so go easy on me. I've had 3 opportunities to collect V694 Mon low resolution spectra. Comparing the results from 3 nights, particularly at 4861 was suggestive, but considering the resolution, hardly quantitative. Still, suggestive.


Cheers
Jim Ferreira, Livermore CA
This is my first time posting to the forum....so go easy on me. I've had 3 opportunities to collect V694 Mon low resolution spectra. Comparing the results from 3 nights, particularly at 4861 was suggestive, but considering the resolution, hardly quantitative. Still, suggestive.


Cheers
Jim Ferreira, Livermore CA