That's great, Peter
You've clearly the rotation of the disk, especially shown with the variation of H alpha profile (emission created in the zoen of the hot spot, i.d. where the flow of material from the red star hits the accretion disk and heats it).
Chapeau bas
François
U Gem in outburst
-
Francois Teyssier
- Posts: 1559
- Joined: Fri Sep 23, 2011 1:01 pm
- Location: Rouen
- Contact:
Re: U Gem in outburst
François Teyssier
http://www.astronomie-amateur.fr
http://www.astronomie-amateur.fr
-
Peter Somogyi
- Posts: 420
- Joined: Sun Jul 13, 2014 8:56 am
Re: U Gem in outburst
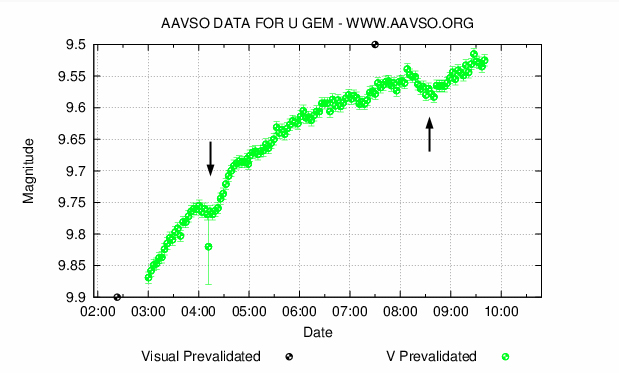
I have created an animation of the last U Gem outburst using the ARAS database, combined with AAVSO chart:
Mostly scripted, but the date at red lines are still put there manually, I plan to calculate that precisely by JD in future.
All specrtum made to common mean except the last one that I halved.
Observers: Francois Teyssier, Joan Guarro, Peter Somogyi [+AAVSO]
- _ugem_20150221_0310_anim.gif (256.17 KiB) Viewed 13302 times
All specrtum made to common mean except the last one that I halved.
Observers: Francois Teyssier, Joan Guarro, Peter Somogyi [+AAVSO]
-
Tim Lester
- Posts: 168
- Joined: Fri Apr 04, 2014 6:31 pm
- Location: Arnprior Ontario
Re: U Gem in outburst
Very nice Peter. I really like the AAVSO insert and moving marker!
I would suggest going even further and using the AAVSO data to produce (approximate) flux calibrated spectra.

In which case a log plot is probably best.
Here is a log plot after doing such a flux calibration. Colored lines on the way up black on the way down.
Tim
I would suggest going even further and using the AAVSO data to produce (approximate) flux calibrated spectra.
In which case a log plot is probably best.
Here is a log plot after doing such a flux calibration. Colored lines on the way up black on the way down.
- U Gem_log.png (16.33 KiB) Viewed 13288 times
-
Paolo Berardi
- Posts: 577
- Joined: Thu Sep 29, 2011 10:51 pm
Re: U Gem in outburst
Great observations and presentations! I wonder if eclipsing nature of U Gem system might have an impact on observed spectra. Every 4h and 15 minutes the secondary red and cool star eclipse the white dwarf (and all the disk?). Photometrically the eclipse lasts 20-25 minutes. Can we expect, in time resolved spectra (like Peter's 6 march sequence), a continuum evolving in some way toward a cool star profile? From light curves it seems that minima have smaller amplitude during the ouburst than in quiescence. May be a lot of the emitting part extends beyond the cool star shape?
Peter, you have included a minimum in your observation of 6 march (around 22:15 UT according to ephemeris), you see any appreciable changes in the single 20 minutes frame profiles taken close to this time? Just out of curiosity...
Paolo
Peter, you have included a minimum in your observation of 6 march (around 22:15 UT according to ephemeris), you see any appreciable changes in the single 20 minutes frame profiles taken close to this time? Just out of curiosity...
Paolo
-
Peter Somogyi
- Posts: 420
- Joined: Sun Jul 13, 2014 8:56 am
Re: U Gem in outburst
Tim,
I just realize how much better to see CVs in logarithmic scale!
Also good to see the values in absolute!
Paolo,
Shame on me, but I've just detected a -1 hour skew error in all my spectra of that day (left a wrong setting in ISIS that time).
Let me publish here the fix, I think 22:15 (2457085.42708) you mentioned is somewhere in the middle, scale is logarithmic:
This is a per-20 minute serie (noisy), used only 1st and last reference star and linear approximated by JD.
(Means blue is rising just because didn't apply ref.star.)
In animated view, finally scripted the JD-MID together with the aavso chart (for other projects), now red line show very precise JD, unfortunately rare of data but useful to show the progress (with jumps):
Hope one of these graphs correlate with your information.
Cheers,
Peter
I just realize how much better to see CVs in logarithmic scale!
Also good to see the values in absolute!
Paolo,
Shame on me, but I've just detected a -1 hour skew error in all my spectra of that day (left a wrong setting in ISIS that time).
Let me publish here the fix, I think 22:15 (2457085.42708) you mentioned is somewhere in the middle, scale is logarithmic:
- ugem_20150306_psomogyi_20mn.png (1.01 MiB) Viewed 13240 times
(Means blue is rising just because didn't apply ref.star.)
In animated view, finally scripted the JD-MID together with the aavso chart (for other projects), now red line show very precise JD, unfortunately rare of data but useful to show the progress (with jumps):
- ugem_20150306_psomogyi_anim.gif (361.27 KiB) Viewed 13240 times
Cheers,
Peter
-
Paolo Berardi
- Posts: 577
- Joined: Thu Sep 29, 2011 10:51 pm
Re: U Gem in outburst
Thanks a lot Peter! Even though there is not an exactly centered frame on minimum instant (2457088.4275), it seems clear that there is no sign of a continuum change near phase zero although there may be a periodic trend with the binary orbital cycle (I see a lowered blue continuum at begin and end of your sequence).
The ephemeris phases are related to central WD while may be that the main source of light forming the continuum come from disk during the outburst, mostly concentrated in the "hot spot" mentioned by François, which is located in a peripheral zone. So, the "light" phase could be different.
For example I found two low amplitudes minima in AAVSO light curve (outburst on 22/2), spaced by about 4h 15m, but not coinciding with ephemeris (about 25 minutes early).
Perhaps photometrists known very well the problem, I'm not an expert.
Orbital phases for your observations, according with Jerzy M. KREINER ephemeris
(http://www.as.up.krakow.pl/minicalc/GEMU.HTM):
JD-mid _____ Phase
2457088.3557 0.594
2457088.3696 0.672
2457088.3836 0.751
2457088.3975 0.830
2457088.4114 0.909
2457088.4377 0.057
2457088.4517 0.136
2457088.4656 0.215
2457088.4795 0.294
2457088.4935 0.373
2457088.5157 0.498
2457088.5297 0.577
2457088.5436 0.656
2457088.5575 0.734
Happy Easter!
Paolo
-
Francois Teyssier
- Posts: 1559
- Joined: Fri Sep 23, 2011 1:01 pm
- Location: Rouen
- Contact:
Re: U Gem in outburst
Great work, Peter, Tim and Paolo
If you agree I take your grapgs for the information letter
The graph extracted by Paolo shows the partial eclipse of the disk by the red dwarf
The spectrum of a cataclysmic is the sum of the spectra of :
- the white dwarf
- the red dwarf
- the disk (and its hot spot, where the material from the red dwarf hits the accretion disk)
In the visible, the spectrum is overhelmed by the disk, hot and large.
The spectra of the WD and red dwart are very faint (because of 1. faint luminosity 2. peak intensity in the far UV for the first one, in IR for the second)
Only in quiescent state, the pseudo continuum of the red dwarf appears, with its strong TiO absorptionbands. It is clear in Joan's spectrum above 6800 A.
The profile of the emission lines at late decline and in quiescence is explained by the formation of lines in an accretion disk (will depend of the inclination) and the hot spot (change of shape), as showed by Peter's series.
The half width of the lines gives a measure of the rotation of the disk.
A good description can be find in Cataclymic variable stars, C. Hellier.
All the best,
François
François Teyssier
http://www.astronomie-amateur.fr
http://www.astronomie-amateur.fr
-
Paolo Berardi
- Posts: 577
- Joined: Thu Sep 29, 2011 10:51 pm
Re: U Gem in outburst
Hi François, thank you for the very helpful information!
Paolo
Paolo
-
Francois Teyssier
- Posts: 1559
- Joined: Fri Sep 23, 2011 1:01 pm
- Location: Rouen
- Contact:
Re: U Gem in outburst
François Teyssier
http://www.astronomie-amateur.fr
http://www.astronomie-amateur.fr
-
Paolo Berardi
- Posts: 577
- Joined: Thu Sep 29, 2011 10:51 pm
Re: U Gem in outburst
Wow, that is a very illustrative model!
Thanks again,
Paolo
Thanks again,
Paolo