Re: Nu Gem at Low Resolution
Posted: Tue Apr 21, 2015 9:57 pm
Hi Andy, I'm glad if that helps in some way!
Yesterday I have observed nu Gem with Lhires III 150. I also observed 26 Gem and two Miles star (HD65900, HD072660) about which we have library spectra, all targets around 41 degree altitude above horizon. A very bright star like Castor should be avoided for an intensity calibration purpose because the atmospheric scintillation could have a great impact on continuum with relatively short exposures.
I "cross-checked" the response curve between the two Miles stars (checking the result using the other star response), finding a good agreement. It is the same as to say that the response curves obtained with the two stars are very similar.
I compare nu Gem with François low-res spectrum in BeSS:
Nu Gem is a complex system that undergone Be and Be-shell phases and the circumstellar disk changes with time, so I think all this may have impact on continuum. More than a year has gone between observations.
Comparison with a nu Gem profile calculated using 26 Gem reference star (response with Pickles A2V library spectrum):
Profiles should have been coincident but, because of the problem described by Robin that said:
Finally a spectrum extended to far red using a Pickles spectrum similar to Miles HD65900 for response curve calculation. Miles library spectra ending at about 7400A while Pickles go beyond (I created a "pseudo-Miles" joining a Miles spectrum and the "tail" of a similar continuum Pickles spectrum)
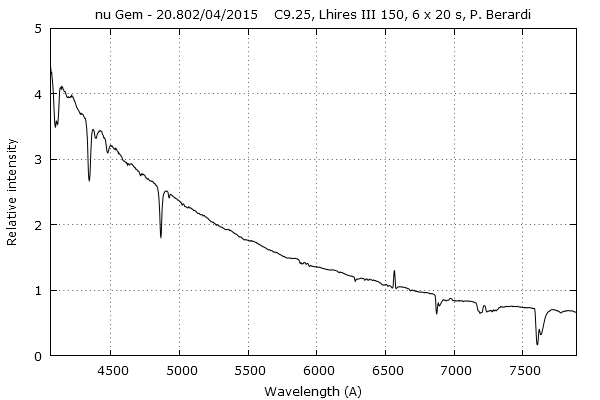
I see some raising of intensities in the far red part of your nu Gem spectrum. As you can see, my profile tends always to decrease toward red wavelengths (I obtain the same behaviour with any usual Pickles library spectrum). The raising of red part of such hot star profiles seems to me quite unusual (but I have not a great experience!). This is why I told you to check for any non-zero value offset in the 2d spectrum frames used for extracting profiles or check if red part of calculated response curve "enters" into telluric absorption bands.
For spectra comparisons I suggest you to scale all low-res profiles in the range 6650-6750A (intensity equal to one). It will be easier to evaluate hotter/cooler continua (but maybe it's a matter of habit...)
Clear sky!
Paolo
PS: you can download my nu Gem profile in FITS format here:
http://quasar.teoth.it/html/spectra/_nu ... tended.fit
Yesterday I have observed nu Gem with Lhires III 150. I also observed 26 Gem and two Miles star (HD65900, HD072660) about which we have library spectra, all targets around 41 degree altitude above horizon. A very bright star like Castor should be avoided for an intensity calibration purpose because the atmospheric scintillation could have a great impact on continuum with relatively short exposures.
I "cross-checked" the response curve between the two Miles stars (checking the result using the other star response), finding a good agreement. It is the same as to say that the response curves obtained with the two stars are very similar.
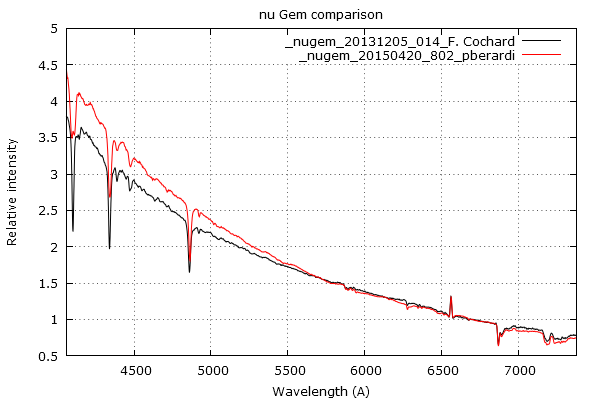
I compare nu Gem with François low-res spectrum in BeSS:
Nu Gem is a complex system that undergone Be and Be-shell phases and the circumstellar disk changes with time, so I think all this may have impact on continuum. More than a year has gone between observations.
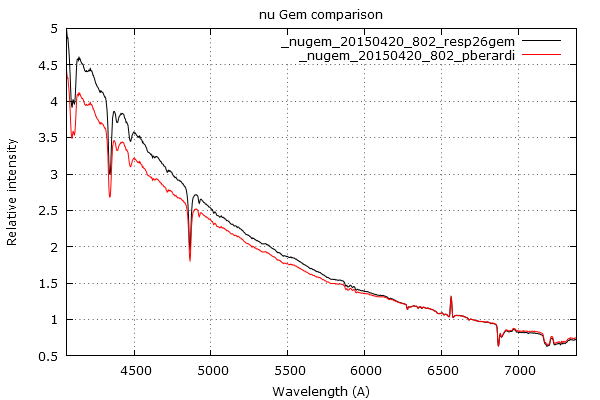
Comparison with a nu Gem profile calculated using 26 Gem reference star (response with Pickles A2V library spectrum):
Profiles should have been coincident but, because of the problem described by Robin that said:
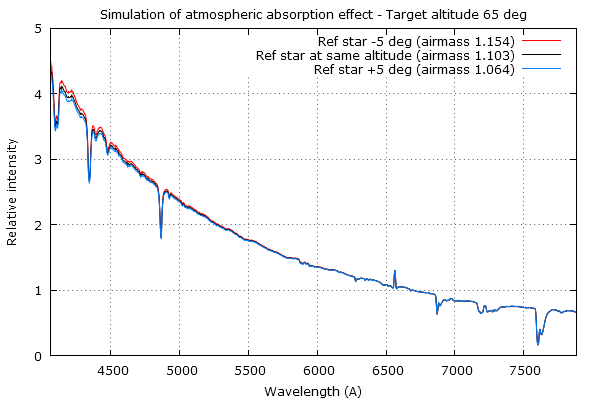
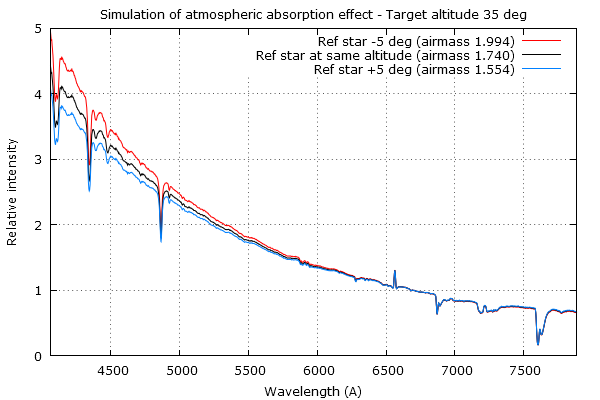
they are different. The profile using 26 Gem as reference star and Pickles A2V is not ok. Note I observed the stars at the same altitude, so atmosphere extinction is not responsible for that deviation.Is the catalogue spectrum of your reference star reliable ? If it is an actual spectrum of the star eg like the MILES stars then it will be but if you are using a generic eg Pickles spectrum then it might not be identical to the actual spectrum of the star used.
Finally a spectrum extended to far red using a Pickles spectrum similar to Miles HD65900 for response curve calculation. Miles library spectra ending at about 7400A while Pickles go beyond (I created a "pseudo-Miles" joining a Miles spectrum and the "tail" of a similar continuum Pickles spectrum)
I see some raising of intensities in the far red part of your nu Gem spectrum. As you can see, my profile tends always to decrease toward red wavelengths (I obtain the same behaviour with any usual Pickles library spectrum). The raising of red part of such hot star profiles seems to me quite unusual (but I have not a great experience!). This is why I told you to check for any non-zero value offset in the 2d spectrum frames used for extracting profiles or check if red part of calculated response curve "enters" into telluric absorption bands.
For spectra comparisons I suggest you to scale all low-res profiles in the range 6650-6750A (intensity equal to one). It will be easier to evaluate hotter/cooler continua (but maybe it's a matter of habit...)
Clear sky!
Paolo
PS: you can download my nu Gem profile in FITS format here:
http://quasar.teoth.it/html/spectra/_nu ... tended.fit