Hola Joan,
My intention is just to objectively compare the data produced by 2 different spectrographs. Different because they are not used in the same way, one is not fixed on a telescope but placed apart in a temperature regulated enclosure, the other is fixed on a telescope and undergoes temperature variations (and also mechanical flexion even if these are weak). One is a fiber spectrograph, the other not (less efficiency for the fiber, but more precision for the light injected in this fiber).
Here's some new comparison with a pixel size of 9,08 µm (bin 2x2) for the eShel and ATIK 460ex, and a pixel size of 11,28µm (bin 3x3) for the Nou-T and ASI 2600 MM Pro.
And for a beter comparison, i try the eShel with others data :
- Same target : RS Oph (but not at the same date)
- Around the same shift of temperature (difference of 2°C between the 1 exposure and the last exposure because I had done tests without the thermal regulation of the eshel last august) and during this night I have not a good weather that's why my last exposure is very weak.
- Here for the eShel spectrum, this is 23 exposures of 180s each (1h 09 minute total exposure)
- Same emission line for comparison between Nou-T and Eshel
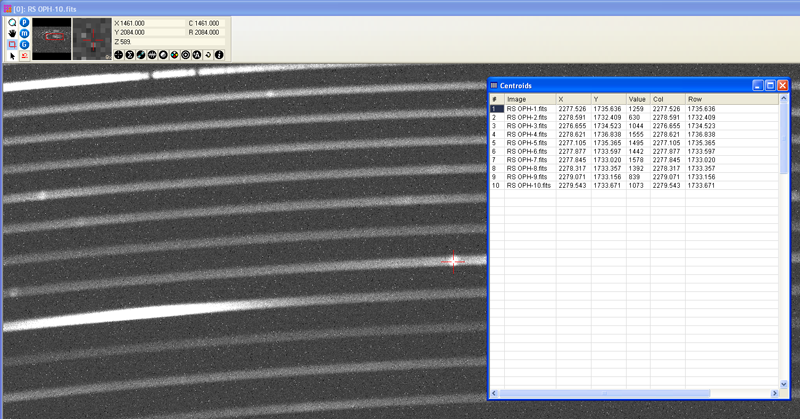
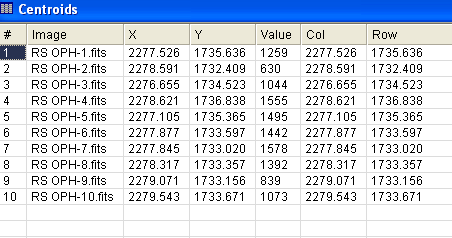
Here's the values of the eShel. Always a centroids.
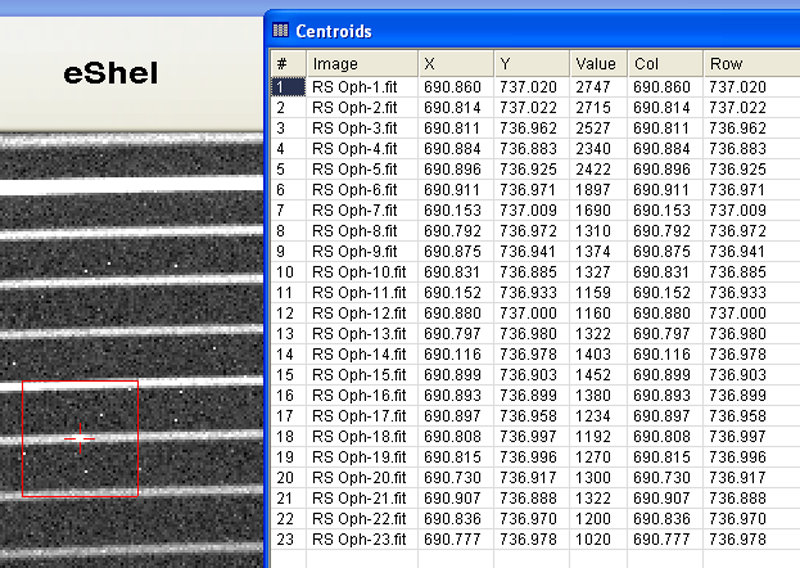
The shift in pixel is in this case (with 2°C difference from the first and last exposure) dx=0,795 pixels and dy=0,139 pixels
Remember that my first test was with a thermal regulation about 0,4°C, so these values are necessarily less good.
So a real shift of 7,218µm in X and 1,26µm in Y
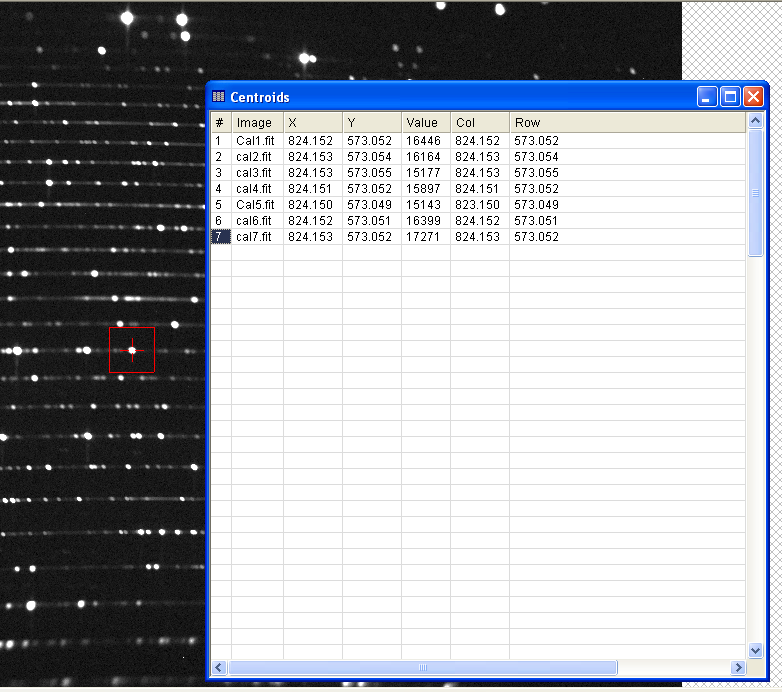
Now the values of the Nou-T in bin 3x3, so a real pixel size of 11,28 µm (9,08µm for the eShel)
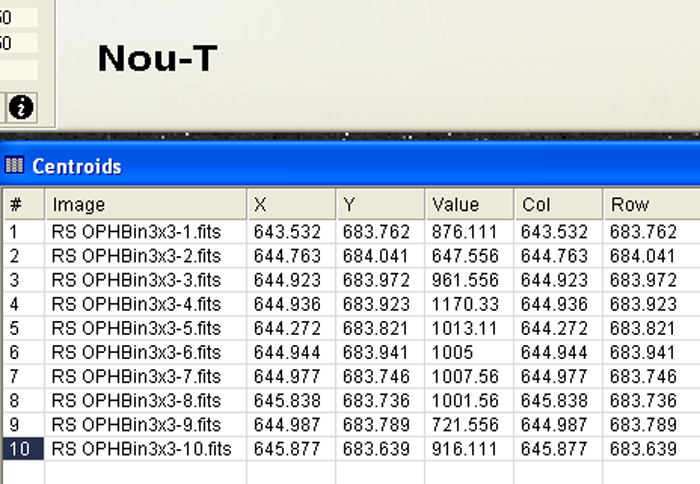
The shift in pixel is in this case (with 1,1°C difference from the first and last exposure) dx=2,345 pixels and dy=0,402 pixels.
So a real shift of 26,45µm in X and 4,53µm in Y
And the animation for the Nou-T (first spectrum #1 and last spectrum #10)
And for eShel (first spectrum #1 and last spectrum #23)
But I think it's normal to have differences. In general case for all spectrograph, there are the typical values :
- a difference of 1°C is an error of 300m/s
- a difference of 1 mBar (atmosphere pressure) is 90m/s error
That why all professional spectrograph in High resolution are in a thermal enclosure with a very good temperature control precision around +/- 0,01°C or less
The second difference is because eShel is not fix on a telescope but yours can have some mechanical flexion.
That's why I put this article comparing eShel and Baches (Baches is fixing on a telescope and has the same problem than Nou-T) :
https://iopscience.iop.org/article/10.1 ... 115001/pdf
All spectrograph design is a compromise between several parameters :
- A spectrograph on a telescope have a better efficiency (no optical fiber, no injection module) but have more shifting issue than optical fiber spectrograph (temperature variation and mechanical flexion).
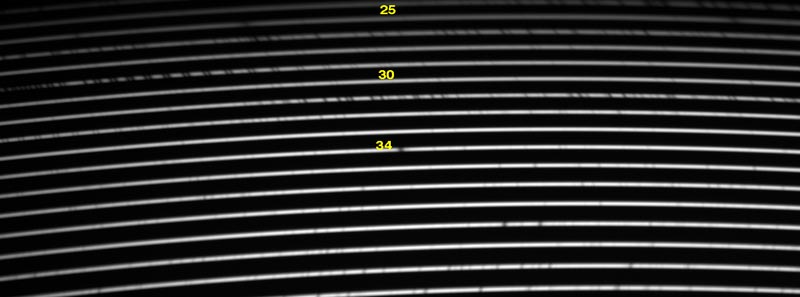
- The wavelength range of the eShel is less than the Nou-T because eShel spectrograph have a filter on the calibration fiber to prevent any bright Argon line up to 7600 Å to disturb others weaks lines from the Th/Ar lamp. We have all orders under 7600 Å, but no calibration lamp to calibrate the orders under #30. That's the choice of Shelyak to not go up after 7600 Å and have a better precision from the range 3900 to 7600 Å.
Do the test by yourself :
- Test your spectrograph "on table" during one hour and take many calibration lamp during this time and compare the values of the same emission line (and also the spectrograph temperature)
- Test your spectrograph on your telescope during one hour with of course the mount on the sidereal velocity during the same time.
In conclusion, if you put the Nou-t in a thermal regulation enclosure and not fix it on the telescope, you can reach the values of the eShel.