Re: Vitesse radiale minimale.
Posted: Thu Sep 30, 2021 12:47 pm
I made a few measurements with Joan's data :
https://drive.google.com/file/d/1zImx8p ... TLxcA/view
and this is what I get
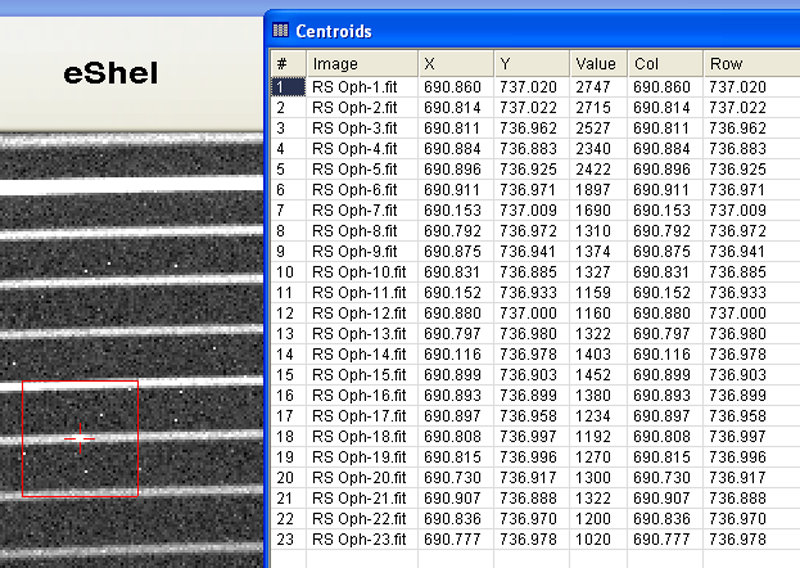
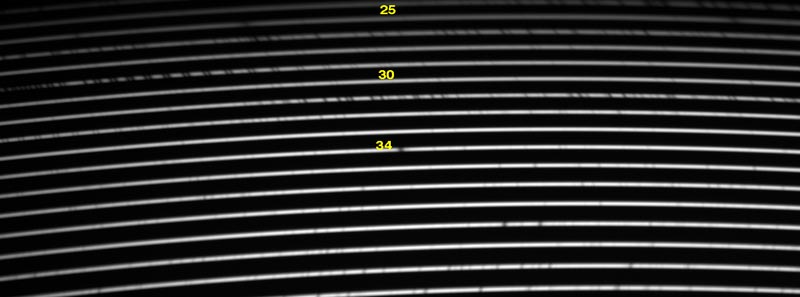
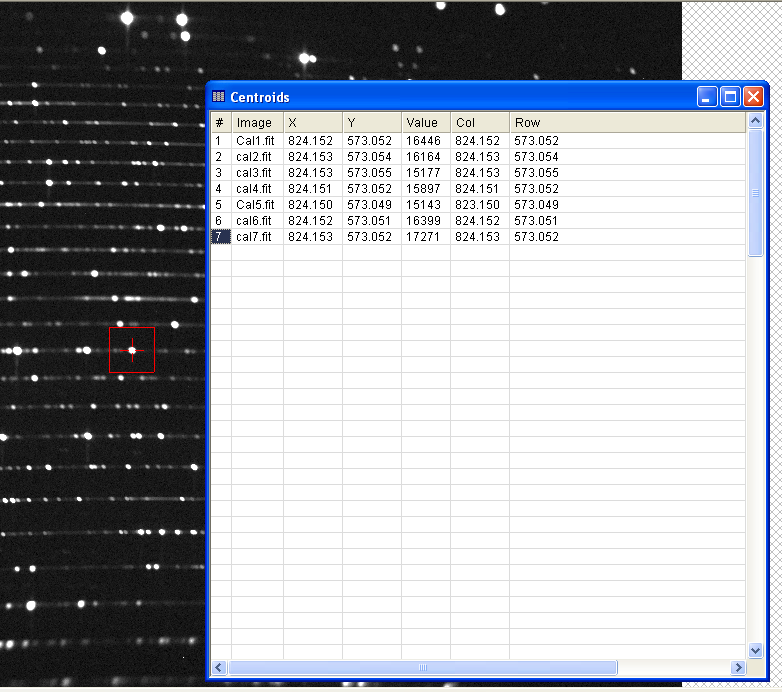
First I measured the centroid of each image on an emission line of the Rs Oph spectrum as shown in the image below
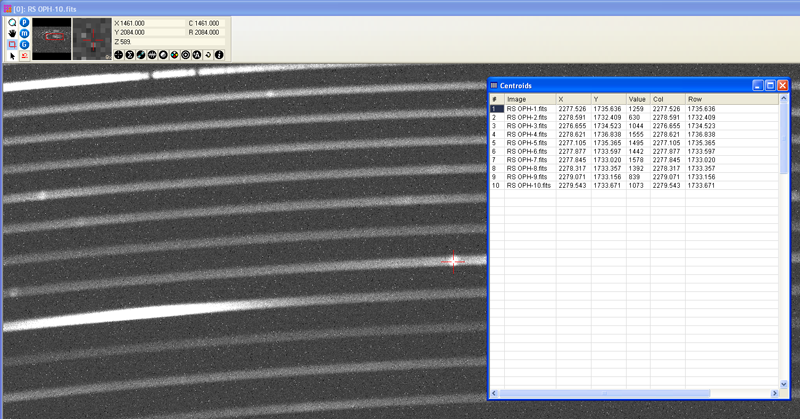
there is a gradual shift of the position in X and Y of each spectrum. Here're the values measured with the Mira Pro software for the same emission line (I think we can have better result using the calibration lamp instead of a star in the sky, but a centroid is a centroid unless the spectrum changes during acquisitions).
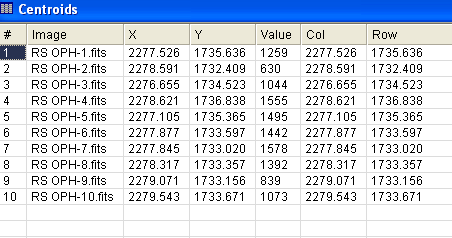
The maximum shift is dX=2,88 pixels and dY=3,818 pixels
The pixel size of the ASI 2600 MM pro is 3,76µm, so a shift dx=10,83µm and dy=14,35 µm
And an animation with the first spectrum and the last
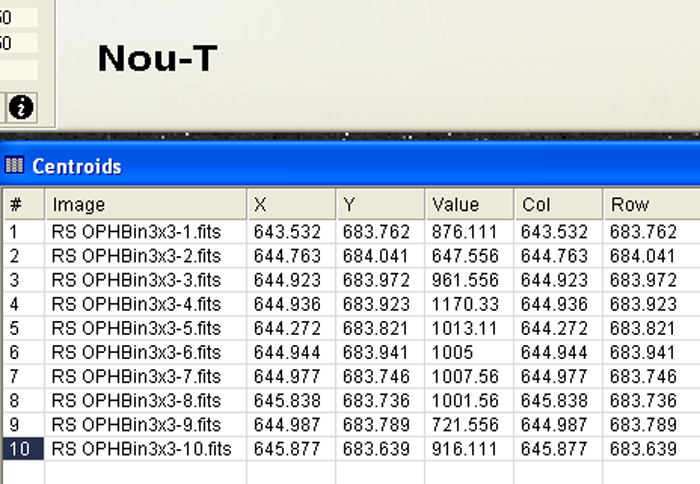
So the spectrograph "move" comparing with some values taken with an eShel with the calibration lamp (during more 3hours of observation). The eshel was in a thermal enclosure and the temperature variation doe's not exceed 0,4°C during 3 hours.
here, the maximum shift is dx=0,03 pixel and dy=0,05 pixel
The pixel size of the ATIK 460ex in bin 2x2 is 9,08 µm so the shift is dx=0,27µm and dy=0,45µm
We have this result because the eshel is in a thermal enclosure, but in the ambiant air (without any thermal regulation), the shift can be more important depending of the temperature variation during observation due to expansion of materials.
Here's an animation with 6 raw spectra taken with an eShel and ATIK 460ex in bin 2x2 (same scale from the previous animation). Observation time around 45minutes.

and here is an article that independently compares 2 commercial echelle spectrograph (eshel from Shelyak vs Baches from Baader)
https://iopscience.iop.org/article/10.1 ... 115001/pdf
https://drive.google.com/file/d/1zImx8p ... TLxcA/view
and this is what I get
First I measured the centroid of each image on an emission line of the Rs Oph spectrum as shown in the image below
there is a gradual shift of the position in X and Y of each spectrum. Here're the values measured with the Mira Pro software for the same emission line (I think we can have better result using the calibration lamp instead of a star in the sky, but a centroid is a centroid unless the spectrum changes during acquisitions).
The maximum shift is dX=2,88 pixels and dY=3,818 pixels
The pixel size of the ASI 2600 MM pro is 3,76µm, so a shift dx=10,83µm and dy=14,35 µm
And an animation with the first spectrum and the last
So the spectrograph "move" comparing with some values taken with an eShel with the calibration lamp (during more 3hours of observation). The eshel was in a thermal enclosure and the temperature variation doe's not exceed 0,4°C during 3 hours.
here, the maximum shift is dx=0,03 pixel and dy=0,05 pixel
The pixel size of the ATIK 460ex in bin 2x2 is 9,08 µm so the shift is dx=0,27µm and dy=0,45µm
We have this result because the eshel is in a thermal enclosure, but in the ambiant air (without any thermal regulation), the shift can be more important depending of the temperature variation during observation due to expansion of materials.
Here's an animation with 6 raw spectra taken with an eShel and ATIK 460ex in bin 2x2 (same scale from the previous animation). Observation time around 45minutes.
and here is an article that independently compares 2 commercial echelle spectrograph (eshel from Shelyak vs Baches from Baader)
https://iopscience.iop.org/article/10.1 ... 115001/pdf