Page 5 of 8
Re: Dramatic change of H alpha profile
Posted: Tue Jul 07, 2015 7:36 am
by Peter Somogyi
Before yesterday I did another experiment with the 600/mm by taking automatically Ne/Ar per exposure, finally I just did "Wavelength Registration" so used only the 1st of them - still saw the skew of lines at higher magnification (1-2A) that Wav.Reg. feature removes - but question then which of my per-exposure calibrations was correct.
So here is the basic result (this time 5 min x 29 frames), all processed by ISIS, using only 1st cal.frame:
- psomogyi_20150705_5min_n29_wavreg.gif (844.1 KiB) Viewed 22372 times
(LHires 600/mm, 15 um slit, ATIK 414 EXm, R~3000 - 2500 in the end, Helioc. corrected)
At least caught a bigger outflow at H-beta, with tons of other lines varying.
The blue peak of Hb was down comparing to previous day.
Cheers,
Peter
Re: Dramatic change of H alpha profile
Posted: Wed Jul 15, 2015 10:09 pm
by Francois Teyssier
H alpha line tonight
Double pic
Almost stable during the acquisition
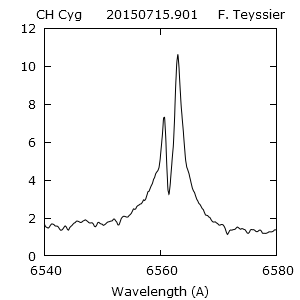
- _chcyg_20150715_901_full.png (8.94 KiB) Viewed 22329 times
Re: Dramatic change of H alpha profile
Posted: Thu Jul 16, 2015 9:49 am
by Jacques Montier
Hi all,
François, we have been recording the same target that night

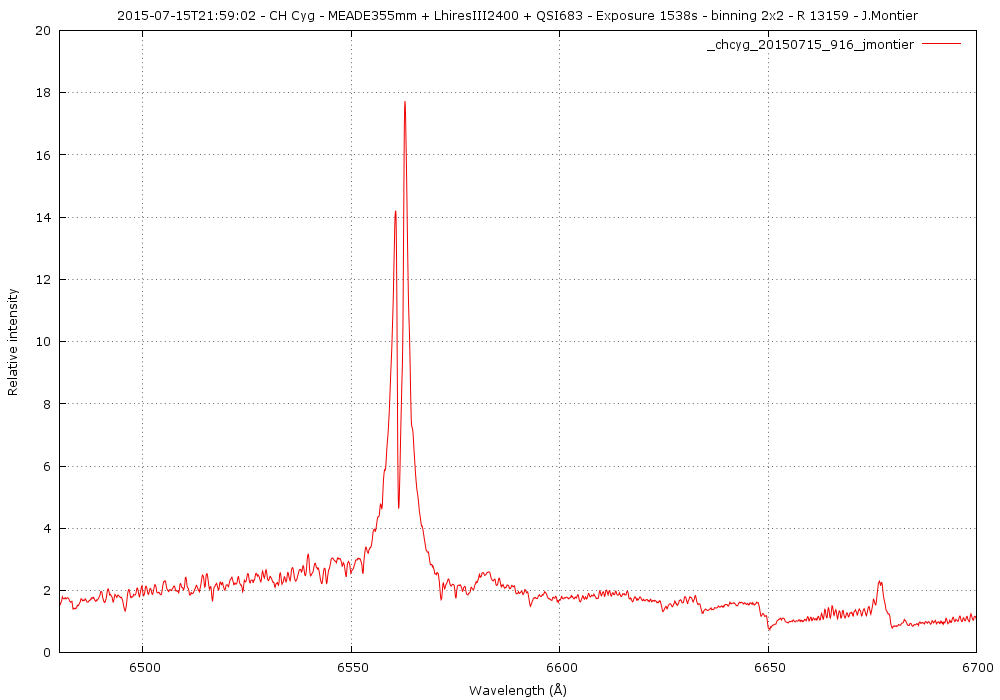
- 20150715_chcyg.png (49.05 KiB) Viewed 22317 times
Cheers,
Re: Dramatic change of H alpha profile
Posted: Sat Jul 18, 2015 3:49 pm
by Peter Somogyi
Last night's session beginning and end:
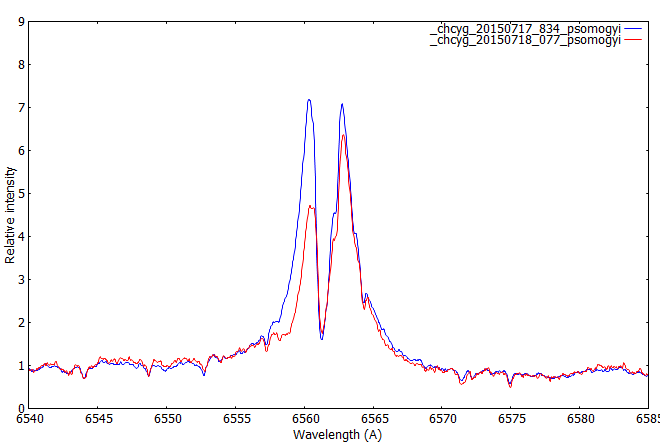
- _chcyg_20150717_18.png (21.05 KiB) Viewed 22288 times
Both end have multiple exposures, but it was not changing enough to compile meaningful animation, and taken other targets in between.
Cheers,
Peter
Re: Dramatic change of H alpha profile
Posted: Wed Jul 22, 2015 7:38 pm
by Benjamin Mauclaire
Hello,
Here is a 2 hours animation of 10 minutes spectra with Lhires3 2400 g/mm and 12" SCT.
Spectra and animation were done sith Spcaudace:
- CH_Cyg_anim.gif (145.04 KiB) Viewed 22258 times
We can see V/R inversion of Ha line while at the same time He I 6678 A line is maximum when V(blue) pic of Ha is at maximum.
Is there any interpretation of such phenomenon?
Cheers,
Benji
Re: Dramatic change of H alpha profile
Posted: Sat Jul 25, 2015 11:47 am
by Miguel Rodriguez
Spectrum from last night. Double peak. L-200 spectrograph with 600l/mm grating. R=4351 computed by ISIS.
Re: Dramatic change of H alpha profile
Posted: Tue Jul 28, 2015 11:55 am
by Olivier Thizy
I took three series of spectra on CH Cygni. Need to finetune my setup to reduce the exposure time as lot happens during the 10 mins exposures!
On july 25th, here is animation over almost 3h observation:
- CH Cygni 20150725.gif (88.28 KiB) Viewed 22204 times
Cordialement,
Olivier Thizy
http://observatoire-belle-etoile.blogspot.fr/
Re: Dramatic change of H alpha profile
Posted: Tue Jul 28, 2015 1:49 pm
by Olivier Thizy
Hello,
Here is a quick comparison between spectrum taken on july 25th and one last night, huge change in two days but actually it changes very quickly sometimes! A star to monitor in high resolution:
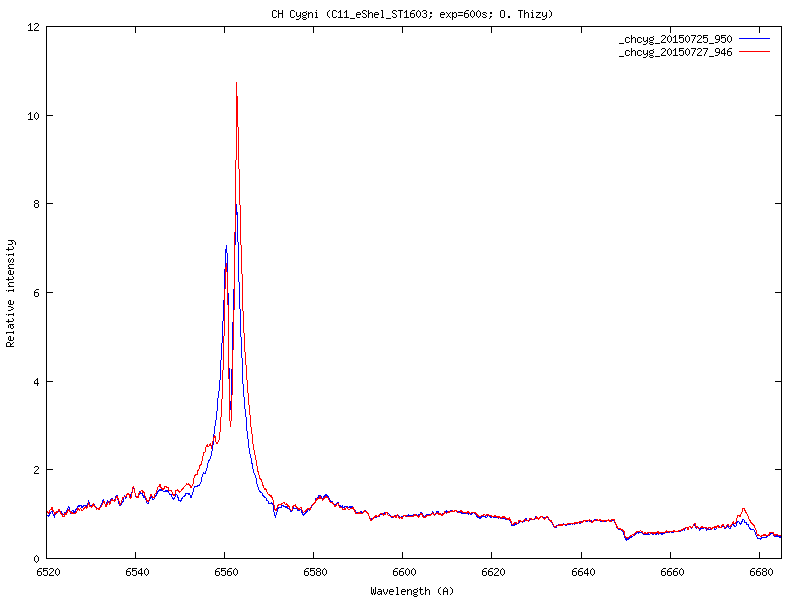
- _CHCyg__chcyg_20150725-27.png (6.32 KiB) Viewed 22194 times
See ARAS march 2015 newsletter for some explanations from Augustin Skopal around this system - still lot to uncover and amateur spectra can help specially if we do a continuous monitoring:
http://www.astrosurf.com/aras/novae/Inf ... etter.html
Specially this newsletter:
http://www.astrosurf.com/aras/novae/Inf ... 015-04.pdf
And couple of pictures taken during the last night acquisition:
Cordialement,
Olivier Thizy
http://observatoire-belle-etoile.blogspot.fr/
Re: Dramatic change of H alpha profile
Posted: Tue Jul 28, 2015 1:52 pm
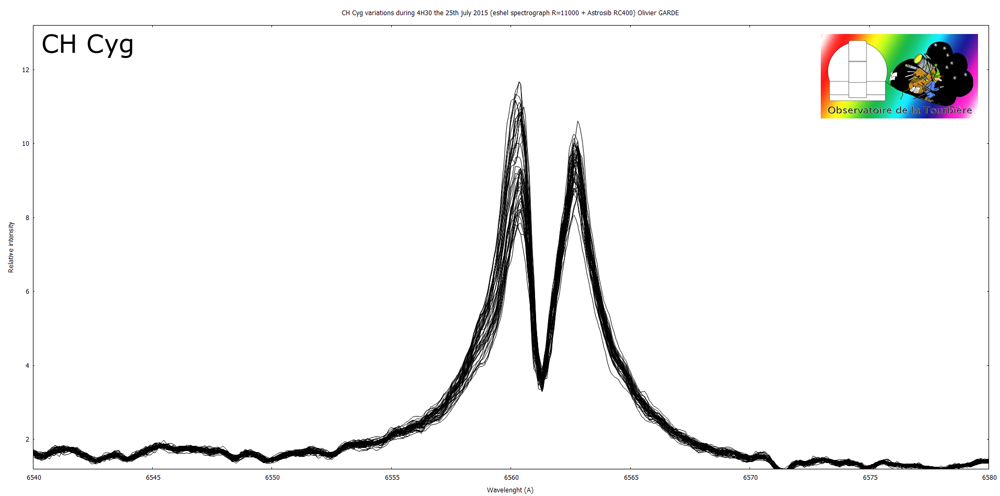
by Olivier GARDE
Here's a time serie during 4H30 (one exposure each 5 minutes), a compilation of 52 spectra taken with eshel spectrograph (R=11000).
The graph show the variation of the blue part of H alpha line;
Re: Dramatic change of H alpha profile
Posted: Tue Jul 28, 2015 2:03 pm
by Benjamin Mauclaire
Hello everyone,
During July 27th, I've made a 7 hours run of spectra (10 minutes each). It started at 10h30 pm local time and stoped at 5h30 am local.
- CH-Cyg_anim_20150727.gif (504.47 KiB) Viewed 22190 times
This automatic observation was done by running a script under Audela.
It takes calibration lamp spectrum every hour, then finish by parking the telescop, switch off all devices, backup and send the archive to the home computer and close observatory's roof.
This time, CH Cyg's spectrum started with an triple pic on Ha line. Then it disapeared.
We still see that maximum emission for blue Ha line and He 6678 line are synchronized.
Clear sky,
Benji