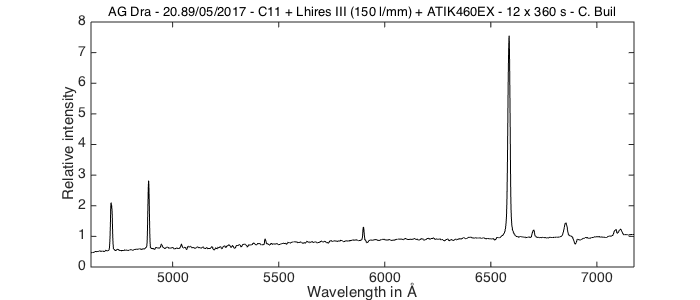
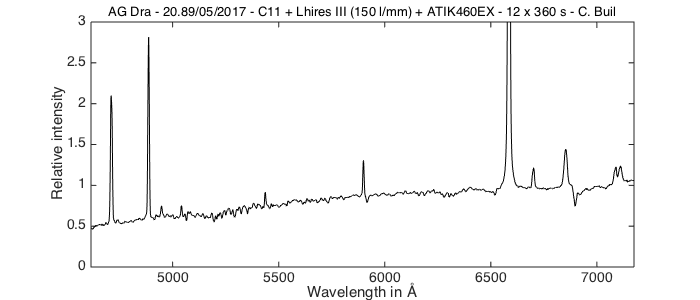
Hello, here is my extracted result about variability of EWs on in the red part (same night as others already reported 05.17-18):
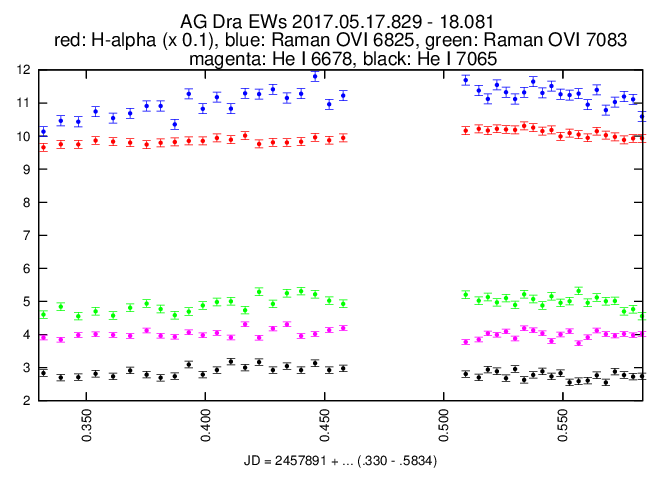
- extracted AG Dra EWs
- AGDra_pso_20170517_EWs.png (28.18 KiB) Viewed 8656 times
This graph is showing error bars, calculated by EWs of conitnuum itself near to it at the same length of selected region, using the stddev formula for the overall result (all scripted via IRAF).
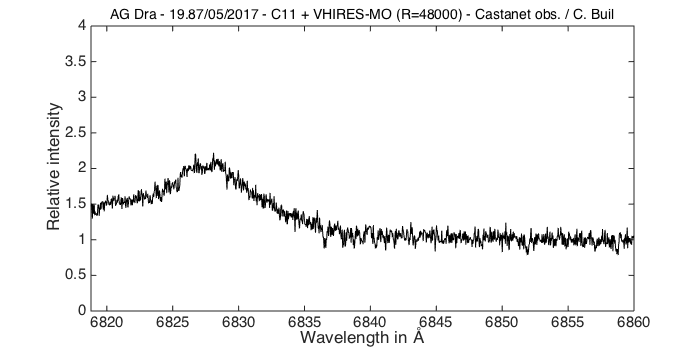
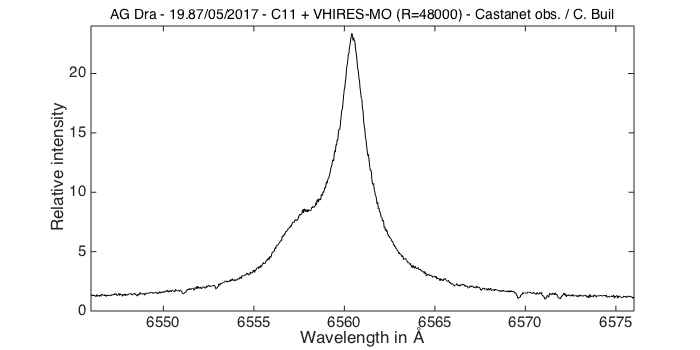
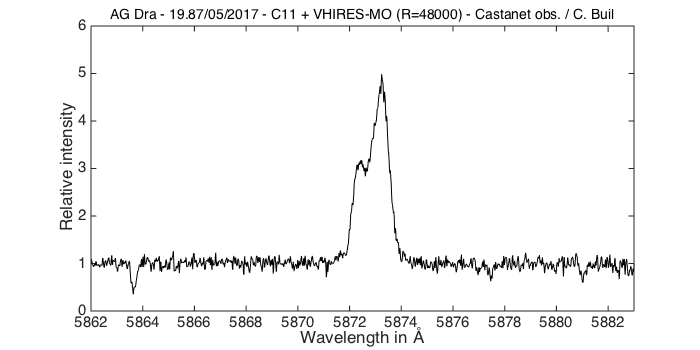
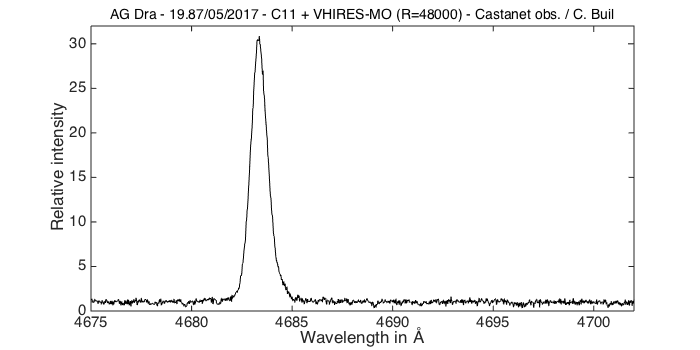
Got 0.15 for the Raman OVI 6825, and between 0.8-0.11 for the other lines (H-alpha is special here: division by 10 except the error).
Exposures was taken of 10 -> 8 -> 5 minutes decreasing in the 2nd half of the night (after scope turnover + took other bands spectra).
This reduction was due to H-alpha started to have a pixel reaching the max ADU on the ccd.
All in all, Raman profiles flicker by 10% during a night, shorter integration times are meaningful!
Cheers,
Peter