C2014Q2

Show your spectra, your results ...
umberto sollecchia
Posts: 242
Joined: Tue Dec 30, 2014 3:25 pm

Re: C2014Q2

Post by umberto sollecchia »

Hi all,

Observed spectrum of comet nucleus for 2 february 2015. All data are reported on graph frame.
C_2014_Q2_02_02_2015.png
C_2014_Q2_02_02_2015.png (40.6 KiB) Viewed 7540 times
Umberto
Joan Guarro Flo
Posts: 620
Joined: Thu Nov 03, 2011 8:50 pm

Re: C2014Q2

Post by Joan Guarro Flo »

After bad weather, a new graphica of the C2014 Q2.

J.Guarro
Attachments
C2014Q2_DAYS20150128_0208.png
C2014Q2_DAYS20150128_0208.png (9.21 KiB) Viewed 7487 times
Joan Guarro Flo
Posts: 620
Joined: Thu Nov 03, 2011 8:50 pm

Re: C2014Q2

Post by Joan Guarro Flo »

To all:

The graph shows the difference in emission intensity of the nucleus of Comet C2014 Q2, on 20150103 and 20150213.

Regards, J.Guarro
Attachments
_C2014Q2_0103-0213.png
_C2014Q2_0103-0213.png (11.1 KiB) Viewed 7475 times
Paolo Berardi
Posts: 578
Joined: Thu Sep 29, 2011 10:51 pm

Re: C2014Q2

Post by Paolo Berardi »

Hi Joan, your interesting comparison shows clearly changes in the comet spectrum.

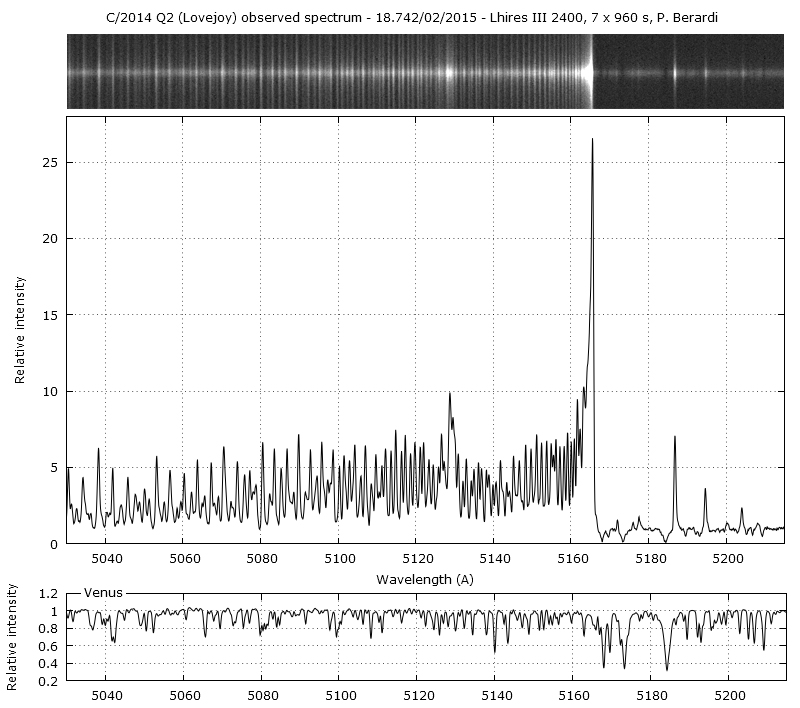
Some modifications are also visible in my hi-res spectra. I observed the comet on 11 feb with Lhires III 2400 (first observation after the upgrade), again in the forbidden oxygen (red doublet) region. Spectral range include also NH2 radical transitions some of which produce a blend with the strong [O I] 6300A in low resolution spectra.

Thanks to a significant geocentric velocity (~ 34 Km/s) that shifted the comet spectrum, the cometary [O I] 6300.30A is now isolated from telluric line and all NH2 (0,8,0) band emission components (remains only a slight overlap with the faint NH2 6300.8 component on the red wing of line). Separation from telluric auroral line is also valid for the other member of red doublet (6363.78A).

Image

Follows a comparison between 13 jan and 11 feb observed spectra.

Image

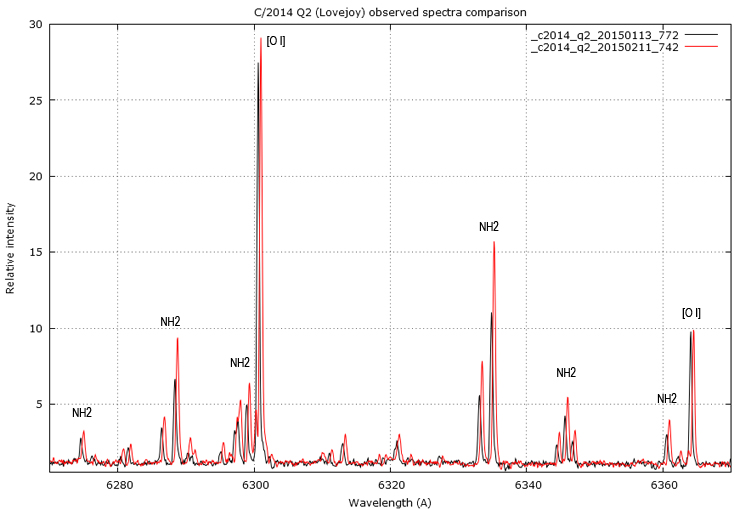
You can notice the differences in evolution between [O I] and NH2 emissions (perhaps for a different excitation mechanism). Latters show a considerable increment of intensity while the former remain . I must say that offset removing during spectra reducing is not an easy task, not being able to use the background zones for sky evaluation (the subject is too large over the slit). So, I hope that I approached a good result, otherwise the comparison is affected. Anyway the consideration about the different evolution of NH2 and [O I] emissions remain valid.

The heliocentric distance of the comet for 13 jan and 11 feb were 0.49 and 0.96 UA respectively.

Paolo
Joan Guarro Flo
Posts: 620
Joined: Thu Nov 03, 2011 8:50 pm

Re: C2014Q2

Post by Joan Guarro Flo »

Ciao Paolo:

You're doing very interesting work. I can give a lot of information on changes in emissions intensity of C2014 Q2, during his tour near the sun.

Amicalment, Joan.
Paolo Berardi
Posts: 578
Joined: Thu Sep 29, 2011 10:51 pm

Re: C2014Q2

Post by Paolo Berardi »

Thanks Joan! Your productivity is, as usual, fantastic! I think that your great comet spectra library will be very useful.

In my post I perhaps wrote a misleading phrase:
Thanks to a significant geocentric velocity (~ 34 Km/s) that shifted the comet spectrum, the cometary [O I] 6300.30A is now isolated from telluric line and all NH2 (0,8,0) band emission components...
Radial velocity allowed to separate only cometary [O I] from telluric line. Other NH2 members are separated thanks to relatively high spectral resolution. Furthermore, concerning comparison spectra, we must consider that intensities are related to the continuum level (that should be lower now).

Paolo
Joan Guarro Flo
Posts: 620
Joined: Thu Nov 03, 2011 8:50 pm

Re: C2014Q2

Post by Joan Guarro Flo »

To all:

Evolution of the nucleus emissions of the C2014q2.

J.Guarro.
Attachments
c2014q2_0104-0219.png
c2014q2_0104-0219.png (12.05 KiB) Viewed 7404 times
Paolo Berardi
Posts: 578
Joined: Thu Sep 29, 2011 10:51 pm

Re: C2014Q2

Post by Paolo Berardi »

Hi all, my last spectrum taken on 18 feb in the main C2 Swan band range. Some NH2 emission lines to the right of C2 bandhead (observed spectrum, R~10000):

Image

Below the Venus spectrum for comparison, taken in the same session and shifted to match comet profile (redshifted for the positive geocentric velocity) . You can see the Mg triplet and other Fraunhofer lines in comet continuum.

Paolo
Christian Buil
Posts: 1431
Joined: Mon Sep 26, 2011 6:59 pm
Contact:

Re: C2014Q2

Post by Christian Buil »

Excellent result ! Interesting to compare with my eShel 9 January spectrum at similar resolution (R=11000).

Christian
Paolo Berardi
Posts: 578
Joined: Thu Sep 29, 2011 10:51 pm

Re: C2014Q2

Post by Paolo Berardi »

Thanks Christian! I'm sending you and François the FITS profile for comet spectra database.

Very comfortable the Ar-Ne lamp in the new calibration module! Until now I used a sort of flatbox with four Filly lamp... For wavelength calibration I used eight emission lines from 5037 to 5221 A on a 10 sec exp frame (with filly lamps I had to expose about 120 sec for a similar result).

Paolo
Post Reply