Halpha EW Time Serie
Posted: Sat Oct 15, 2011 10:50 am
Hi,
I tried a time serie yestersday on P Cygni.
It consists in 24 spectra (each spectra is the sum of 9 images) acquired during 2 hours (19:55 to 21:55 UT) every 5 minutes.
EW Halpha is measured between 651.5 and 661.5 nm. The continuum is estimated in the ranges [649.5 nm ; 651.5 nm] and [661.5 nm ; 663.2 nm]
Here's the result : EW(Ha) = f(Julian Date)
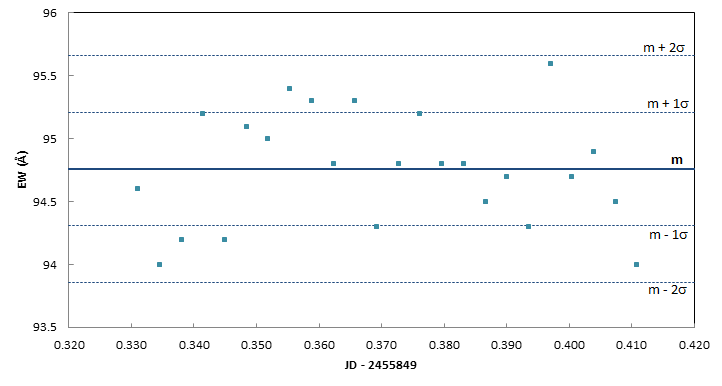
The mean value is EW = 94.8 angströms ; the standart deviation of the 24 measures is 0.45 (i.e. about 0.5%).
Mean value, mean +/- 1 sigma and mean +/- 2 sigma lines on the graph.
All the measures are in the interval ( m - 2 sigma, m + 2 sigma).
There's non tend. The slope of a linear regression curve is 0.
Conclusion : at a resolution R = 1000, no variability in EW is détected, during that 2 hours survey.
Corollary, the error in measurement, with a snr of the continuum of about 100, is 0.5%. No so bad. Interesting order of magnitude for similar studies (for R = 1000, of course)
Best regards
François Teyssier
I tried a time serie yestersday on P Cygni.
It consists in 24 spectra (each spectra is the sum of 9 images) acquired during 2 hours (19:55 to 21:55 UT) every 5 minutes.
EW Halpha is measured between 651.5 and 661.5 nm. The continuum is estimated in the ranges [649.5 nm ; 651.5 nm] and [661.5 nm ; 663.2 nm]
Here's the result : EW(Ha) = f(Julian Date)
The mean value is EW = 94.8 angströms ; the standart deviation of the 24 measures is 0.45 (i.e. about 0.5%).
Mean value, mean +/- 1 sigma and mean +/- 2 sigma lines on the graph.
All the measures are in the interval ( m - 2 sigma, m + 2 sigma).
There's non tend. The slope of a linear regression curve is 0.
Conclusion : at a resolution R = 1000, no variability in EW is détected, during that 2 hours survey.
Corollary, the error in measurement, with a snr of the continuum of about 100, is 0.5%. No so bad. Interesting order of magnitude for similar studies (for R = 1000, of course)
Best regards
François Teyssier