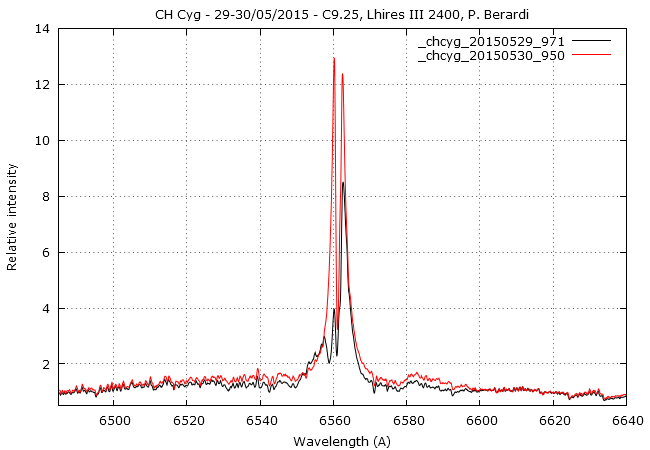
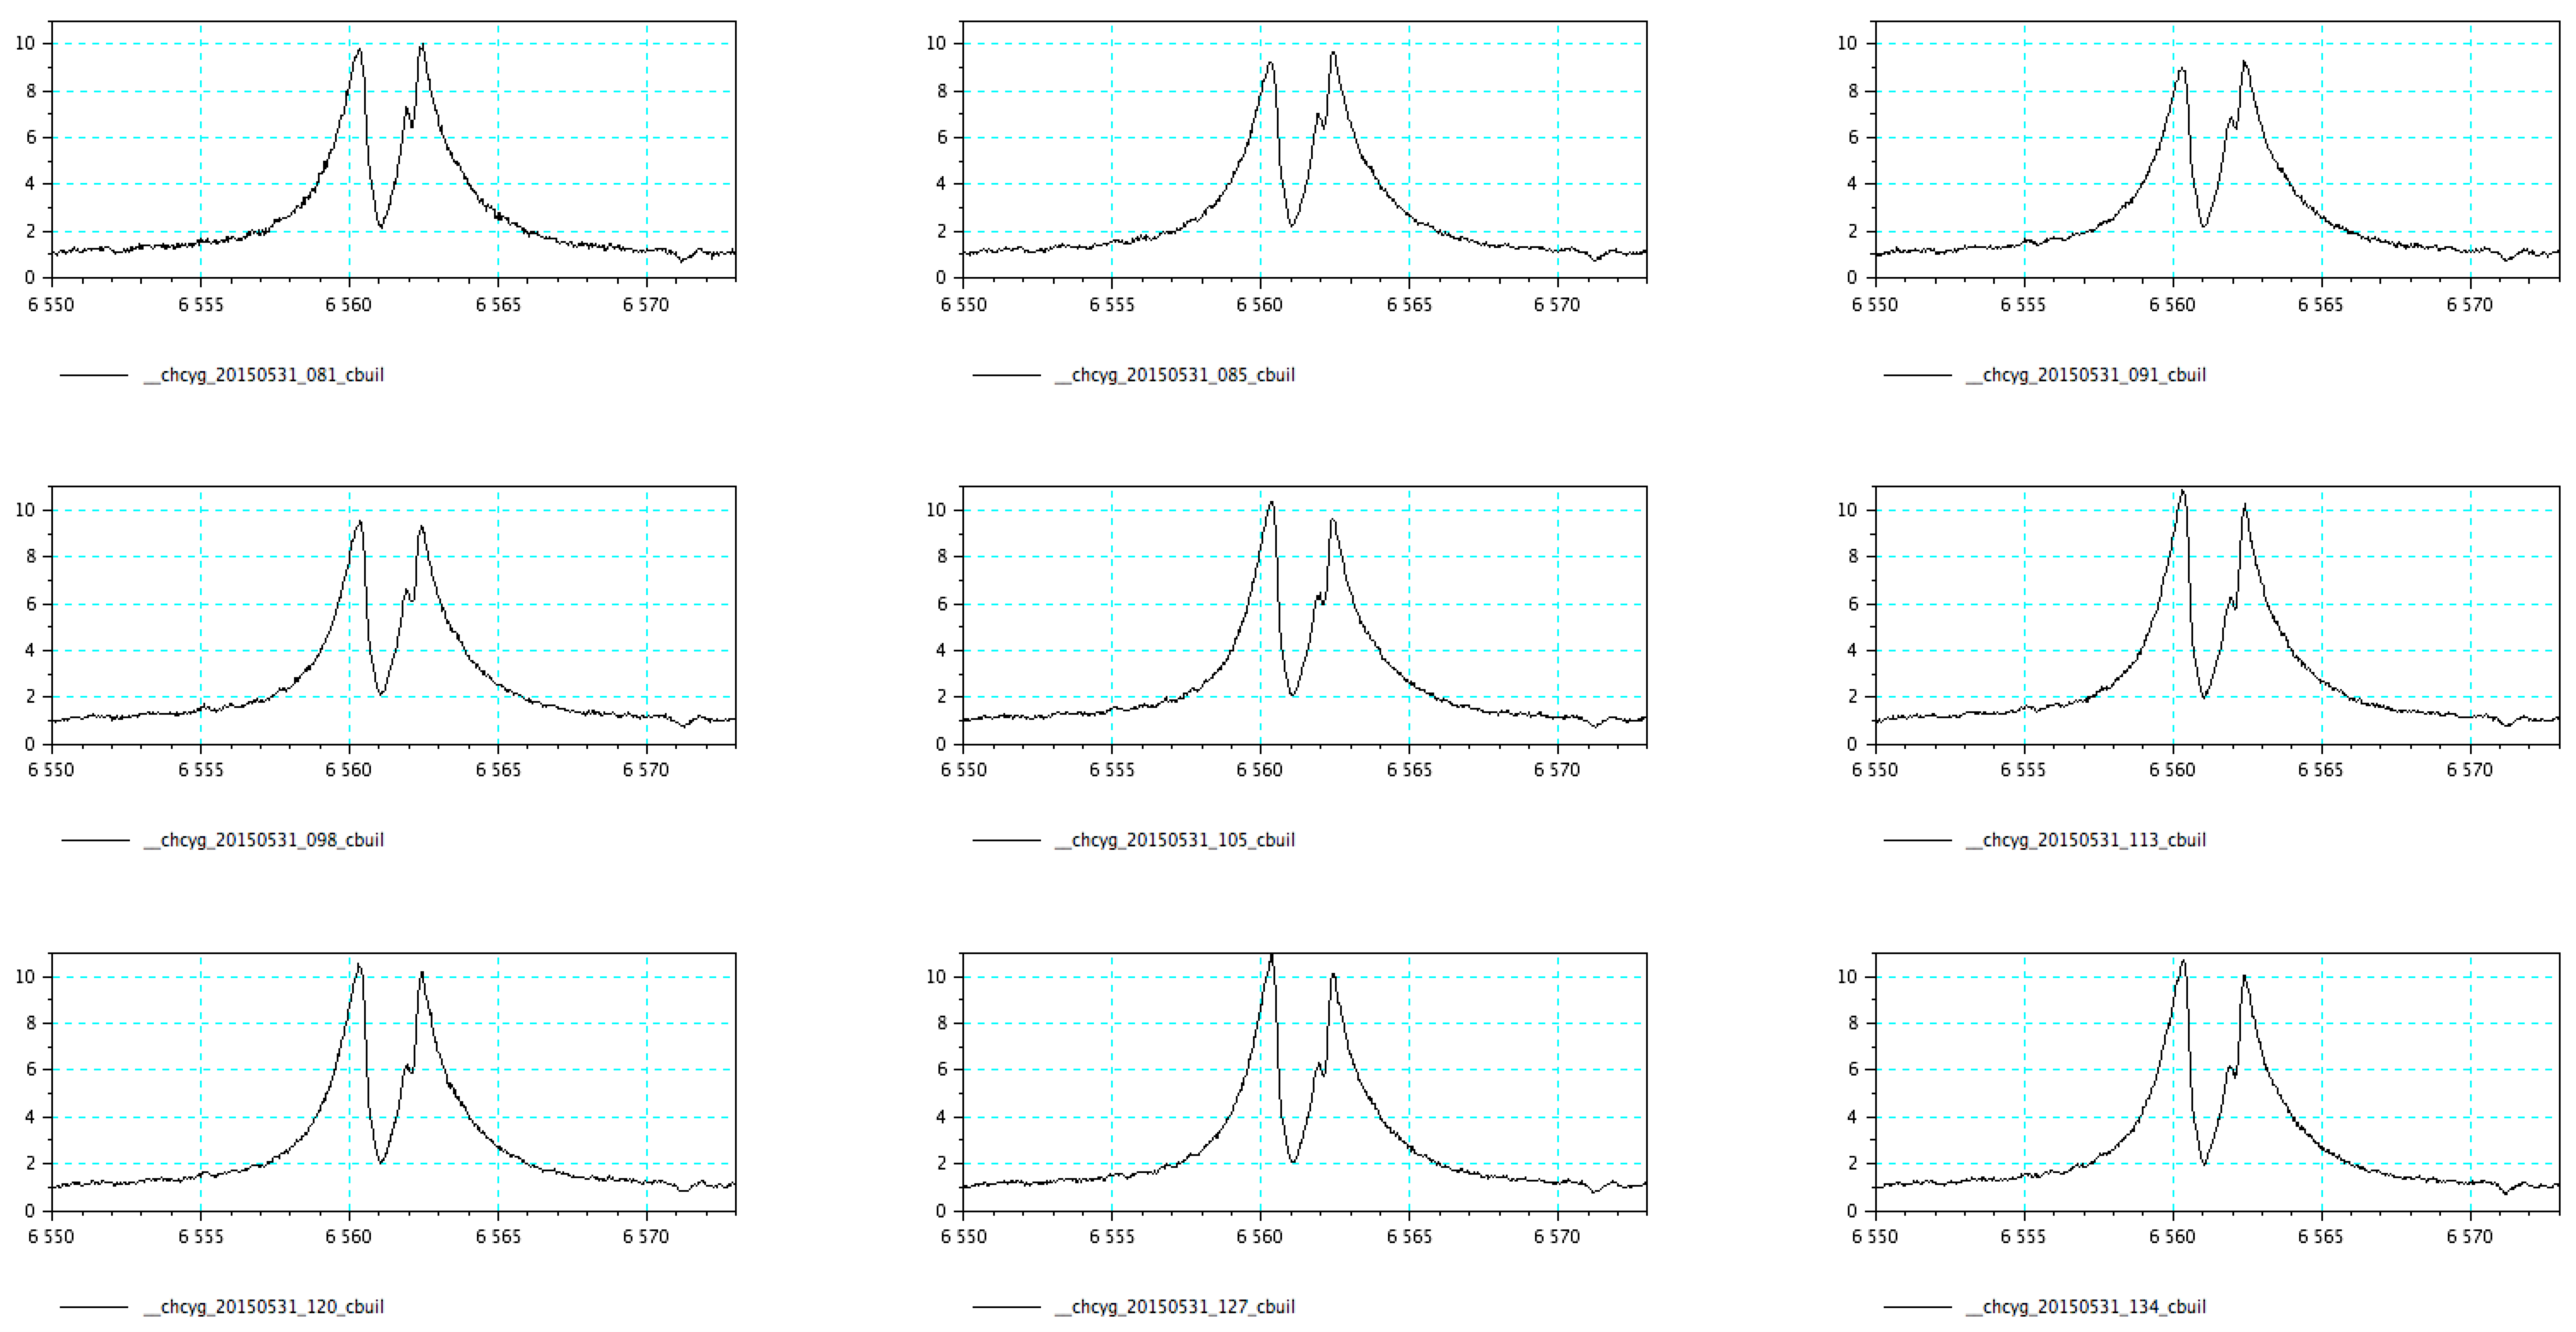
I have gathered last month's high resolution (R~10000) spectra from last month, and created a compilation around H-alpha.
Multiplied each with an individual constant, chosen carefully by creating 3-order continuum for each - rejecting the varying 6545-6580 region! - and finally used only their averages to pick the proper constant. (IRAF was able to fit that continuum specifying 2 separate ranges - simple normalization won't work properly here!)
Created an animated gif with using AAVSO:
- animated correlation
- result.gif (441.93 KiB) Viewed 46816 times
Resolution and author per downloaded files from the ARAS database:
_chcyg_20150408_284_tlester.fit: R~8990, Tim Lester
_chcyg_20150412_096_full.fit: R~11000, Francois Teyssier
_chcyg_20150415_103_full.fit: R~11000, Francois Teyssier
_chcyg_20150418_983_full.fit: R~11000, Francois Teyssier
_chcyg_20150421_132_full.fit: R~11000, Francois Teyssier
_chcyg_20150422_011_psomogyi.fit: R~13374, Peter Somogyi (35um slit)
_chcyg_20150424_090_full.fit: R~11000, Francois Teyssier
_chcyg_20150425_113_psomogyi.fit: R~21446, Peter Somogyi (15um slit)
_chcyg_20150426_964_psomogyi.fit: R~21077, Peter Somogyi (15um slit)
_chcyg_20150427_971_fteyssier.fit: R~11000, Francois Teyssier
Special thanks to JM (Robert James) and AAVSO for having the R and B magnitudes!