Page 1 of 1

V404 Cyg in outburst

Posted: Sun Jun 28, 2015 7:30 pm
by Franck Boubault
Dear All,


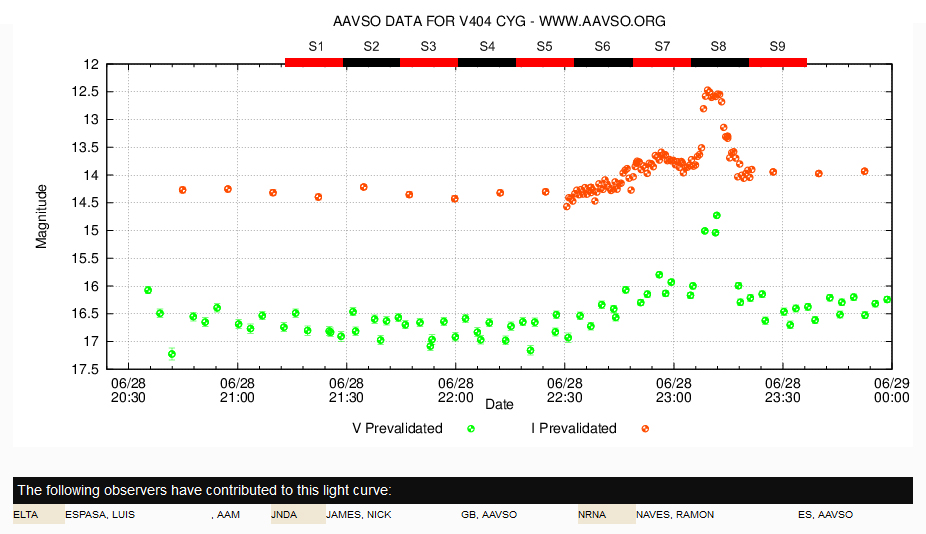
V404 Cyg is going into outburst.

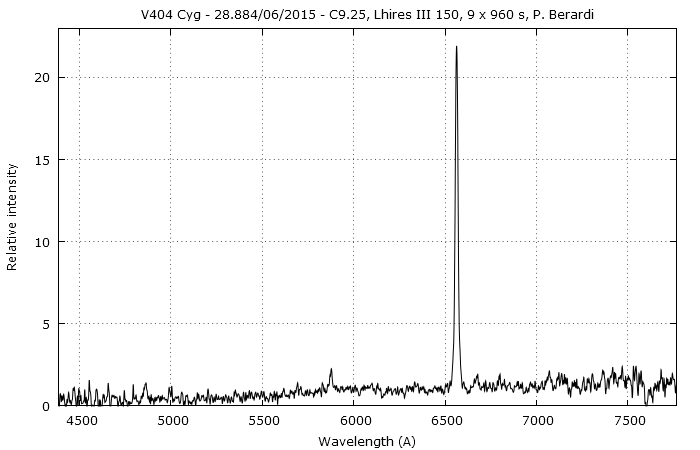
Dr Olivier Godet (Midi-Pyrénées Observatory, France) asks for spectra.

He adds the following information : the last eruption occured more than 20 years. It is a very bright X ray source (more than 40 - 45 times the Crab Nebula). A multi-wavelength campaign is active from radio to gamma wavelength. My collegue Mickael Coriat contributes to the radio monitoring of this source, which is of special importance for the research of our team.

A spectroscopic survey is of very high interest. The position of V404 Cyg is :
RA(J2000) = 20:24:03.78; Dec(J2000) = +33:52:03.2.

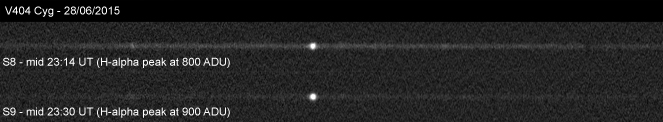
If possible, in accordance with the magnitude of the object, short integration times are welcome to monitor the temporal evolution.

Spectra at low and high resolution must be sent to francoismathieu.teyssier at bbox.fr for inclusion in ARAS Data base

Clear Sky !

Franck Boubault

Re: V404 Cyg in outburst

Posted: Mon Jun 29, 2015 3:13 am
by Francois Teyssier
Impressive variations of luminosity.
It dropped to mag 18 !

V404Cyg.PNG
V404Cyg.PNG (24.03 KiB) Viewed 7461 times

Re: V404 Cyg in outburst

Posted: Mon Jun 29, 2015 3:26 pm
by Franck Boubault
Dear All,

I saw V404 Cyg yesterday in the field of my guiding camera.
I estimate its magnitude around 16 (measurements at 21 H 27 UT and 21 H 47 UT).
It was clearly too faint for my setup to take a spectra.

Franck

Re: V404 Cyg in outburst

Posted: Mon Jun 29, 2015 6:17 pm
by Paolo Berardi
Hi all, an observation attempt for 28/06/2015, Lhires III 150 and C9.25.

Ch Cyg was very faint at the beginning of observing session (mag V from 16.5 to 17). From 22:30 UT the brightness began to increase, with a peak of mag V 14.7 around 23:10 (as reported on AAVSO light curve). "High" luminosity state lasts about 10 minutes.

Spectra time coverage is shown on top of AAVSO light curve graph. Each red/black bar represents an individual spectrum frame (960s exp time).

Image

Spectra are very noisy, so I have integrated all frames to obtain the following profile:

Image

Perhaps it is interesting to note that before maximum, continuum and H-alpha emission grew up together. After maximum the continuum has dropped while H-alpha reached the maximum intensity. See the 2d spectra comparison of the eighth and ninth sub-exposure:

Image

I used a narrow slit (31 microns), so spectra intensities over time may not be very reliable (high data dispersion) but it seems to me that this change can be real. Anyone can confirm? At the moment AAVSO graph does not include R band magnitudes.

Paolo

Re: V404 Cyg in outburst

Posted: Fri Jan 01, 2016 4:21 pm
by Peter Somogyi
Hi all,

V404 has rebrightened yesterday, taken 10 x 600s till reaching the trees, it was quite variable.

2D images after procerssing, without dividing by flat:
v404_2d_noflat.png
v404_2d_noflat.png (359.49 KiB) Viewed 7118 times
Weighted sum of spectra by Ha-peak ADU:
v404_cyg_plot.png
v404_cyg_plot.png (26.11 KiB) Viewed 7118 times
Animation, intensity scaled in 6555 - 6569A, then multiplied by Ha-peak ratio:
_v404cyg_20151231_702_psomogyi.gif
_v404cyg_20151231_702_psomogyi.gif (122.43 KiB) Viewed 7118 times
Ha-peak values I've applied, read from the ISIS processed 2D image max of H-alpha peak value:

[number] [day interval] [ADU]
1.: .2019 - .2089: 277 ADU
2.: .2096 - .2166: 365 ADU
3.: .2166 - .2236: 334 ADU
4.: .2236 - .2306: 202 ADU
5.: .2306 - .2376: 211 ADU
6.: .2375 - .2445: 218 ADU
7.: .2445 - .2515: 278 ADU
8.: .2515 - .2585: 372 ADU
9.: .2585 - .2654: 336 ADU
10: .2654 - .2724: 319 ADU

JD: 2457388.2019 + 10 x 600 sec (continuous from the 3rd frame)

I wish you all a happy new year!

Cheers,
Peter