EW Computation (further discussion opened by Marco)
Posted: Sat Nov 05, 2011 6:31 pm
Further discussion opened by Marco on spectro-l list.
I used the spectrum sent by Marco in my excel spreadsheet.
The results are :
Direct computation ( simple integration) EW = 16.03
Gaussian fit : EW = 15.93 and center = 6562.81 (excellent wavelenght calibration, Marco !)
(The Gaussian fit is a simple gaussian curve, with one compound).
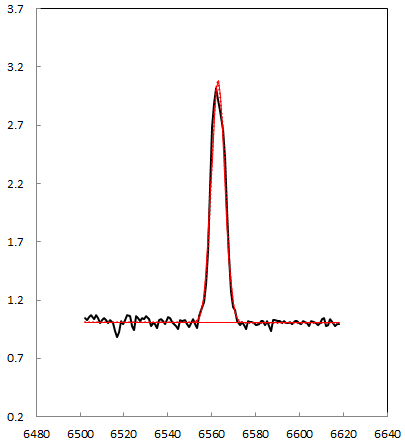
Less than 1% diffrence between the two measurements.
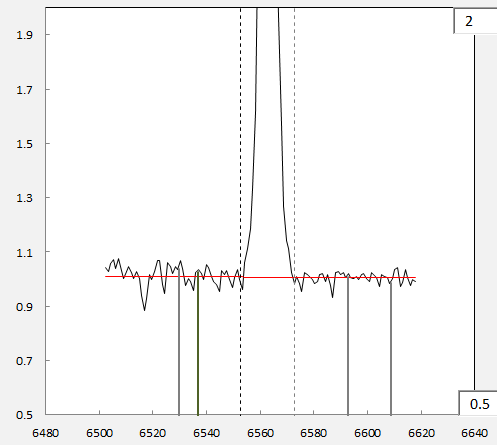
Determining the edges of the line does not pose problems
Here's the integration range is [6553,6573]
If I adopt the range used by Marco [6548,6578], the EW becomes 15.96 : only 0.7% difference.
The real difficulty is : where is the continuum ?
François Teyssier
I used the spectrum sent by Marco in my excel spreadsheet.
The results are :
Direct computation ( simple integration) EW = 16.03
Gaussian fit : EW = 15.93 and center = 6562.81 (excellent wavelenght calibration, Marco !)
(The Gaussian fit is a simple gaussian curve, with one compound).
Less than 1% diffrence between the two measurements.
Determining the edges of the line does not pose problems
Here's the integration range is [6553,6573]
If I adopt the range used by Marco [6548,6578], the EW becomes 15.96 : only 0.7% difference.
The real difficulty is : where is the continuum ?
François Teyssier