T CrB & R CrB Spectra
Posted: Sat Mar 25, 2017 3:41 am
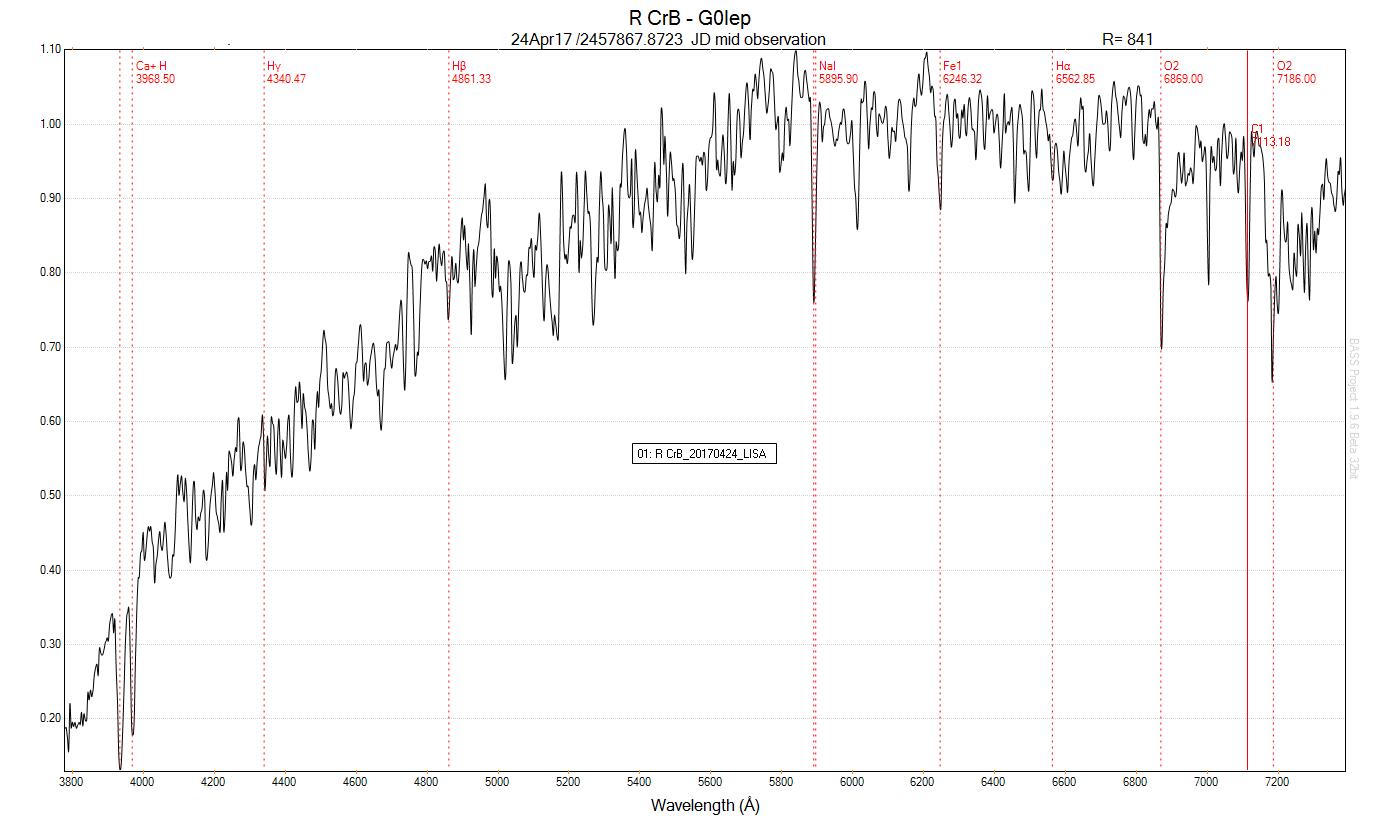
Here is my recently Isis processed spectra of R CrB (plotted in BaSS 1.96):
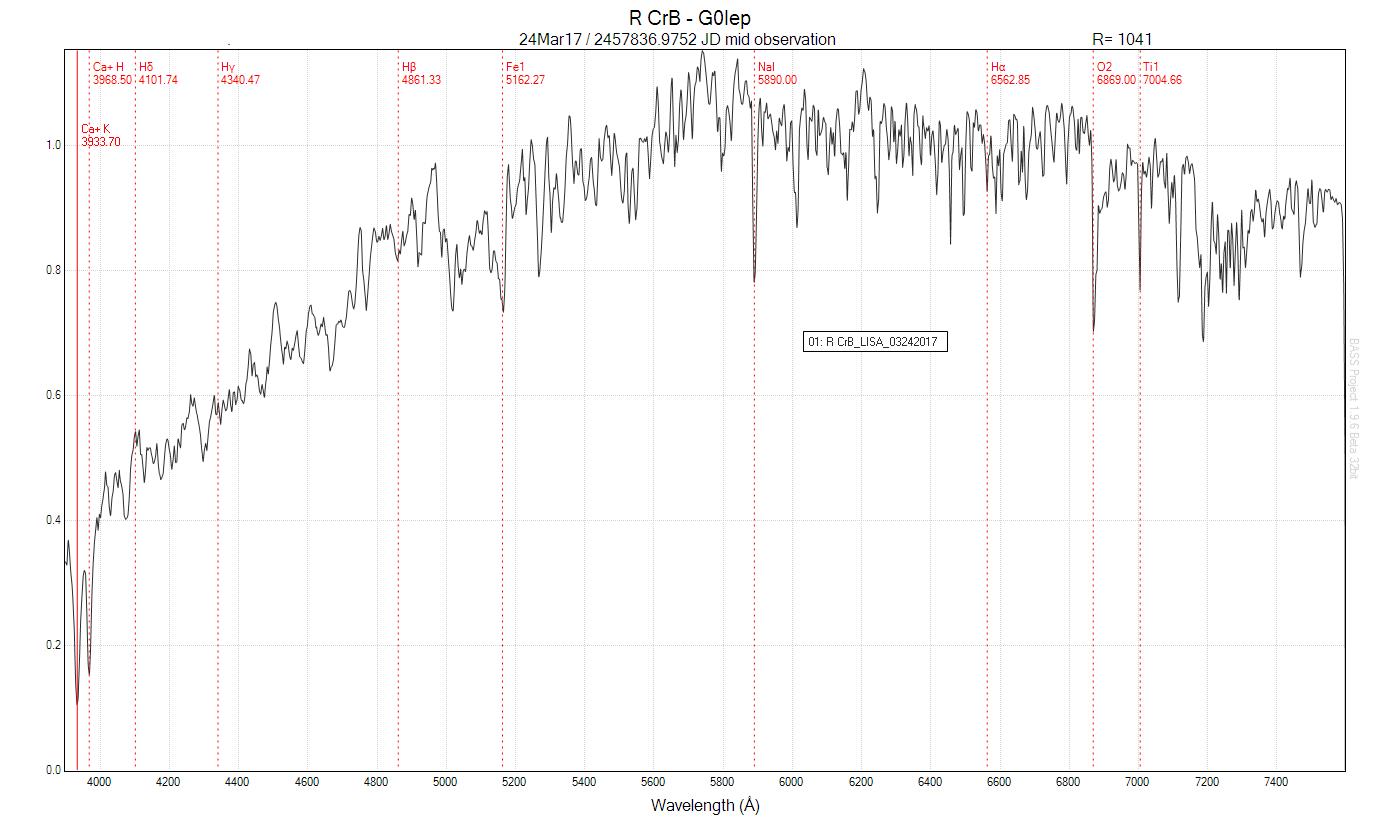
There is definite activity in the near UV -end in the Ca+K and Ca+H lines, while the rest of the balmer series (Ha, Hb, Hy, H-delta) looks weak. For a Yellow-Orange supergiant,
this star has interesting Na Fe, and Ti lines; much more rarefied/cooler solar wind than the sun for these complex metal to form. The O2 at 6869A is very prominent.
This was shot at an air mass of Z(sec)= 1.05
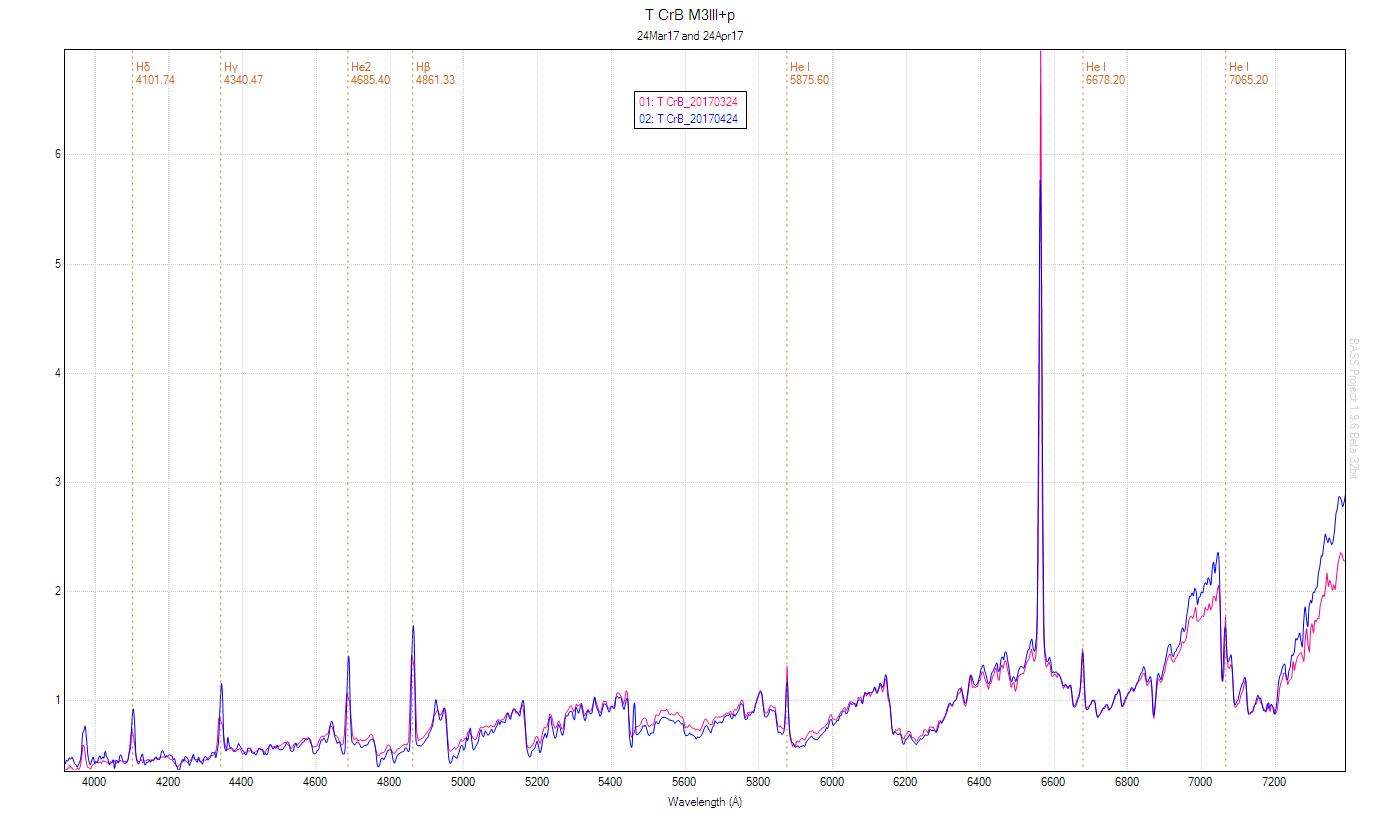
Here is my recently Isis processed spectra of T CrB (plotted in BaSS 1.96):
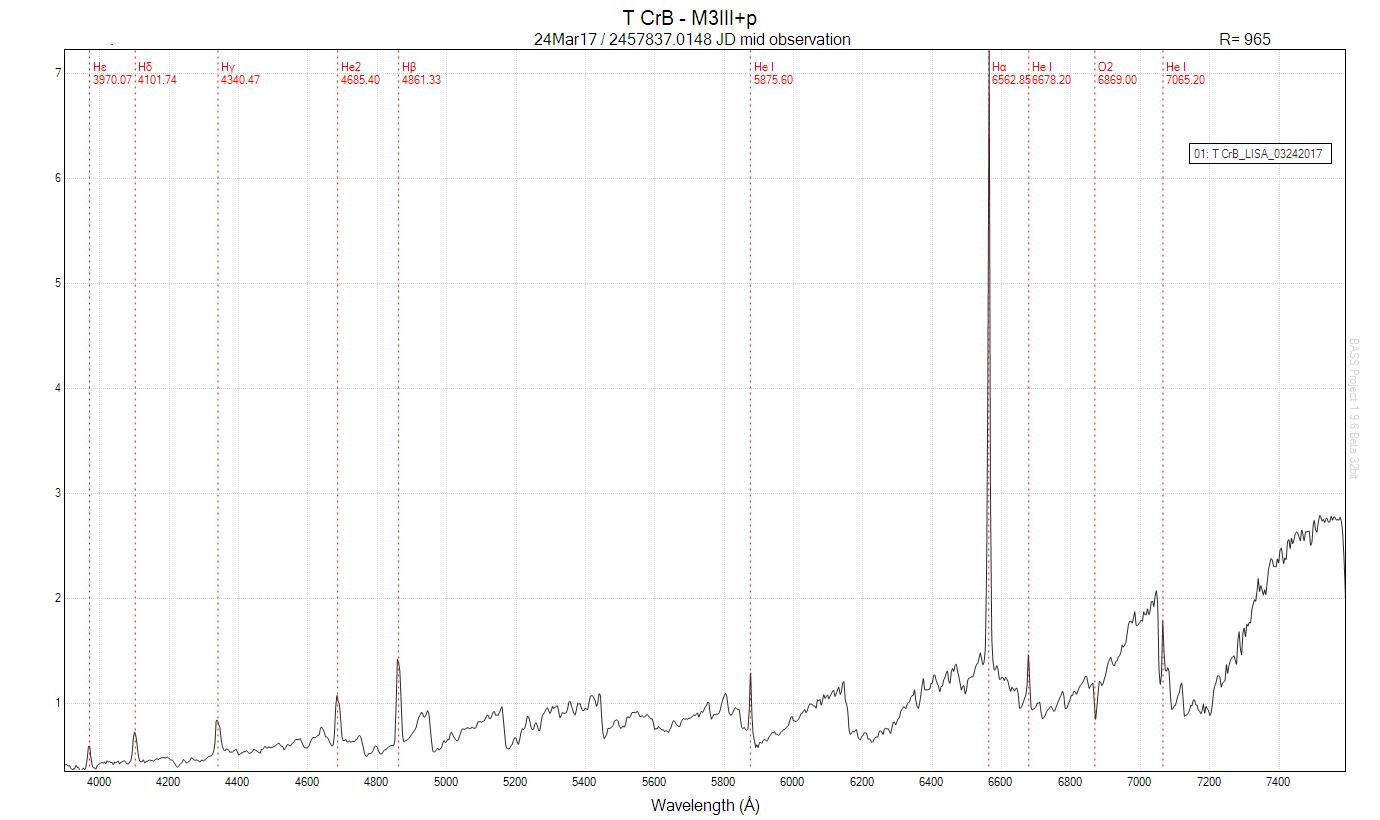
A much cooler and dimmer star than R CrB. It has numerous HeI and HeII emission lines and very pronounced Ha emission at 7x the intensity of the continuum average.
Note, the typical see-saw patter of Carbon emissions increasing from shorter to longer wavelengths. This will definitely be a target for my LISA with the IR extension kit!
This was shot close to the air mass of R CrB. Both spectra were instrument response calibrated on the same nearby A3V star SAO84281.
James
There is definite activity in the near UV -end in the Ca+K and Ca+H lines, while the rest of the balmer series (Ha, Hb, Hy, H-delta) looks weak. For a Yellow-Orange supergiant,
this star has interesting Na Fe, and Ti lines; much more rarefied/cooler solar wind than the sun for these complex metal to form. The O2 at 6869A is very prominent.
This was shot at an air mass of Z(sec)= 1.05
Here is my recently Isis processed spectra of T CrB (plotted in BaSS 1.96):
A much cooler and dimmer star than R CrB. It has numerous HeI and HeII emission lines and very pronounced Ha emission at 7x the intensity of the continuum average.
Note, the typical see-saw patter of Carbon emissions increasing from shorter to longer wavelengths. This will definitely be a target for my LISA with the IR extension kit!
This was shot close to the air mass of R CrB. Both spectra were instrument response calibrated on the same nearby A3V star SAO84281.
James