Hi everyone,
Good news! TESS sectors 14 and 15 are now available, and I am beginning to incorporate your data into the analysis of a few systems. This will take some time since there are a lot of stars with different properties. I'm starting with HD_194779, which transitions from disk-less, to posessing a weak disk that dissipates over a few weeks. This disk even was captured nicely in spectroscopy (Halpha mainly) and overlaps nicely with the TESS observations.
Maybe it is easier to view via this link rather than the image in this post:
https://drive.google.com/open?id=11PQnW ... 6nuHjjirxw
The plot here has a lot of info, which I break down below. From top to bottom, the panels show...
1) The frequency spectrum (power vs. frequency [cycles per day]) from TESS.
2) A wavelet analysis of the TESS data. This shows how the significant frequencies change over time.
3) TESS light curve. Vertical colored lines mark epochs of spectroscopic observations.
4) Halpha equivalent width, plotted so that higher values = more emission.
5) Halpha peak separation.
6) V/R ratio of the Halpha peaks.
Then the rest are some choice lines from the spectra. The large Halpha plot has an offset that corresponds to the spacing in time betweeen observations, while the rest are simply all the spectra stacked with no offset.
Here is a summary of what all this is telling us. The TESS data (via the top two frequency plots) show a strong signal near 1.1 cycle per day. This signal is strongest near TESS_JD = 1720 (easy to see in the wavelet plot, and you can also see this by eye in the LC). This is probably the dominant pulsation mode, and is typical for Be stars. There is another significant frequency just below this, at about 1 c/d. The TESS light curve also shows other slower variation (at low frequencies). This is obvious by eye if you look at the LC, and you can also see these signals in the frequency spectrum (the power at low frequencies). Some time between the first and second spectrum the star starts to build a weak disk, seen in Halpha. This disk then dissipates over the next ~3-4 weeks. You can see this in the Halpha line profile, the peak separation, and the EW.
Is it noteworthy that the disk build-up corresponds to about when the pulsation signal is strongest? Maybe! This is the sort of question we can start to answer as the sample grows, and is only possible with these sort of simultaneous phot. + spec. monitoring efforts.
There are some things I need to improve. One is to take all quiescent spectra of this star to get a nice average Halpha profile in the disk-less state. Then better measurements can be made of this disk build-up episode. Also, I need to incorporate other spectra that are not yet posted on BeSS.
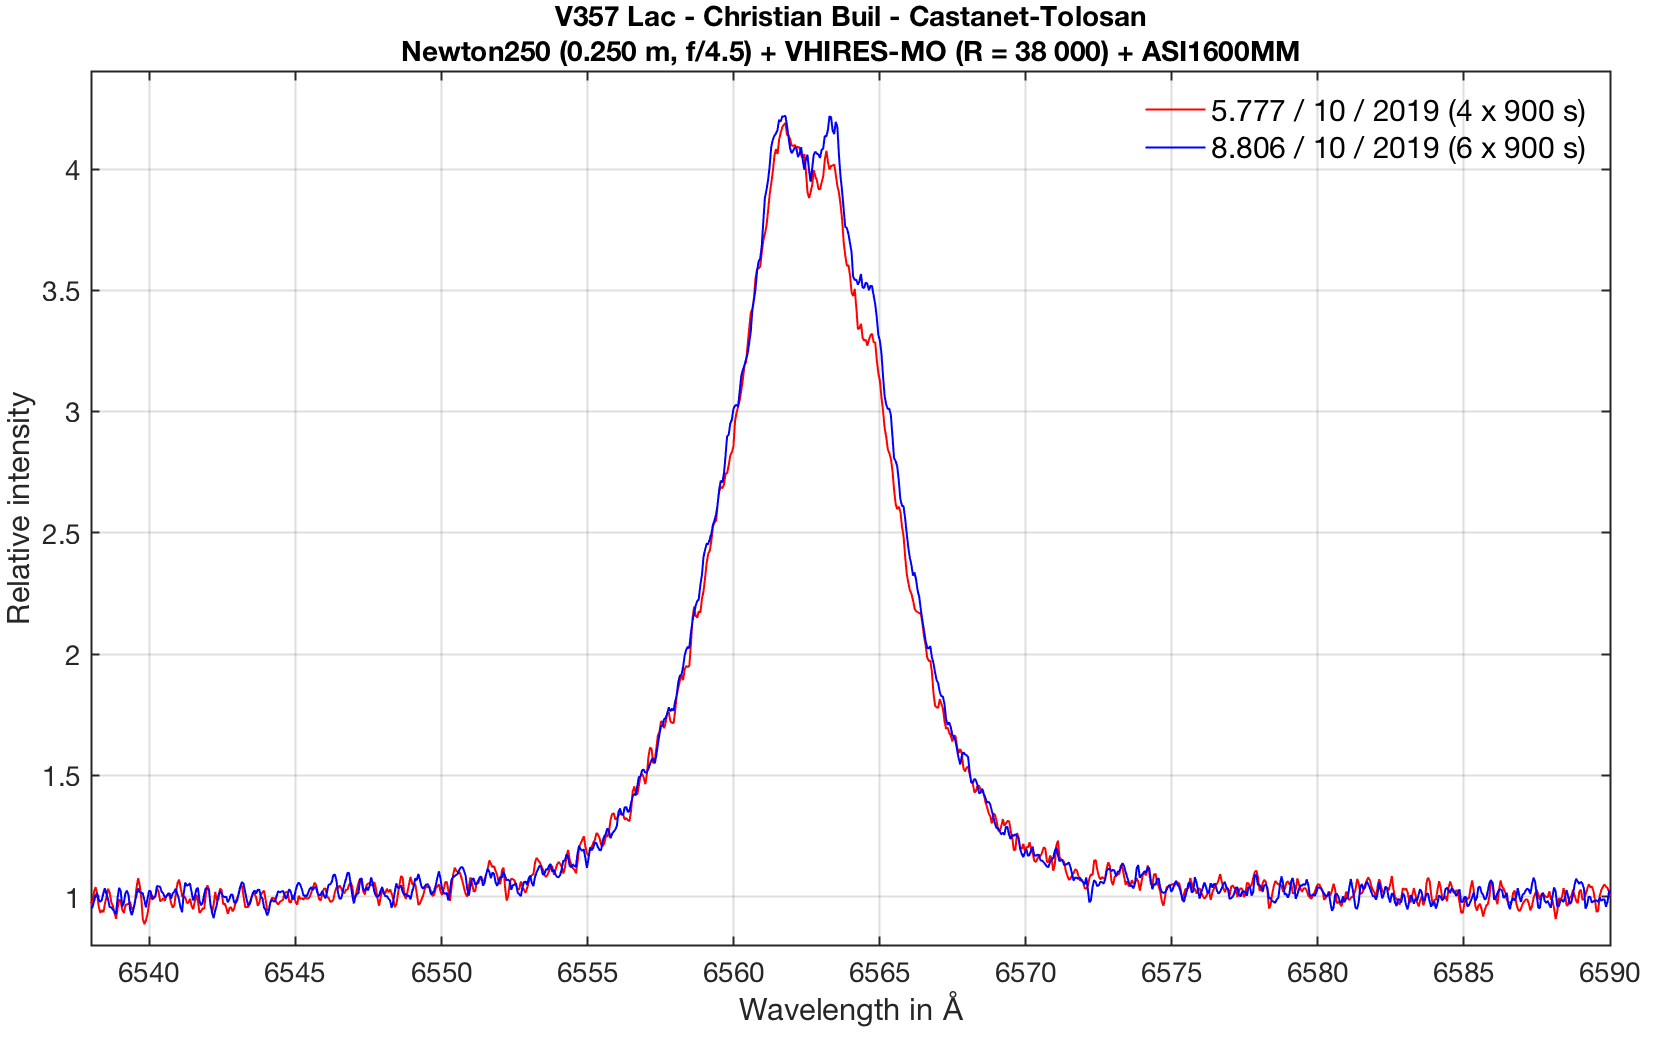
Also, I have begun to monitor V357_Lac with NRES a few times a night. Already it is obvious that there is variation even from one hour to the next. All of your observations over the past month have made it clear that this is an ideal target and give me confidence in dedicating 5 observations per night every night for the next month while TESS is still observing it (until Nov. 2).
TESS will soon switch from sector 16 to sector 17 (on Oct. 7), and I will update the spreadsheet soon. Keep up the good work!
-Jon