I know the best way to avoid contamination involves the use of a "blocking filter" (longpass with yellow-red cutoff), then taking two spectra of target (with and without filter) and joining them to obtain a full range spectrum. This method has the drawback of having to perform two separate integrations, effectively doubling the exposure time. No problem with bright targets but can be annoying if we are studying faint objects.
I have a couple of (crazy?) ideas developed thanks the use of a small 3.8 degree prism (the one used to minimize chromatic coma of SA100) as a cross-disperser, with dispersion axis perpendicular to grating dispersion. The resulting effect is the separation of spectral orders. This allows to appreciate the contamination zone (where two subsequent orders overlap), the true end of 1st order (assuming that the prism does not absorbs IR light, I only verify there isn't any relevant UV absorption). We can work with isolated 1st order and study the relationship between first and second order.
Here is showed the effect of prism on A and M type star spectrum:
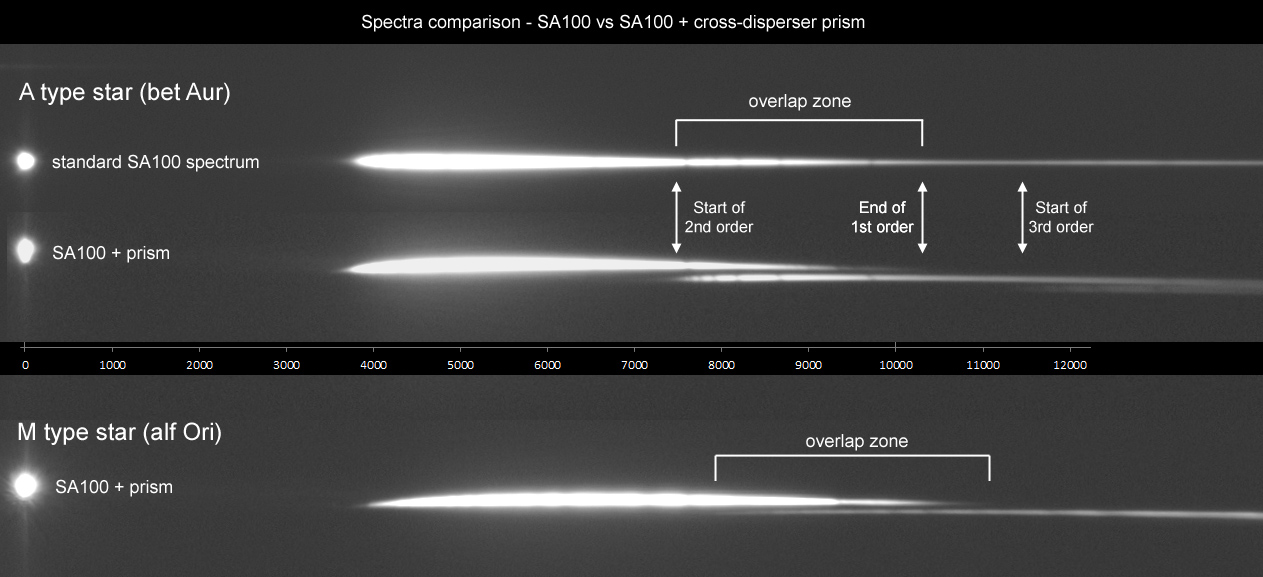
The bent spectrum is due to nonlinear dispersion of prism. A similar effect also occours taking spectra of low elevation targets with horizontal dispersion axis. In this case is the atmosphere which acts as cross-disperser.
Note the 3rd order contribution. In a classical use of grating, spectra with a sufficient SNR seem to never end (that is reaching background value), the 1st order IR spectral range remain dominated by violet/blu light of other orders.
The first idea is to work on isolated 1st order. My attempt has been to include only the first order in the binning area for profile extraction. Not very easy because the second order is close. I got a good compromise appropriately tilting the dispersion axis. Given the particular geometry, a nonlinear wavelength calibration offer better results.
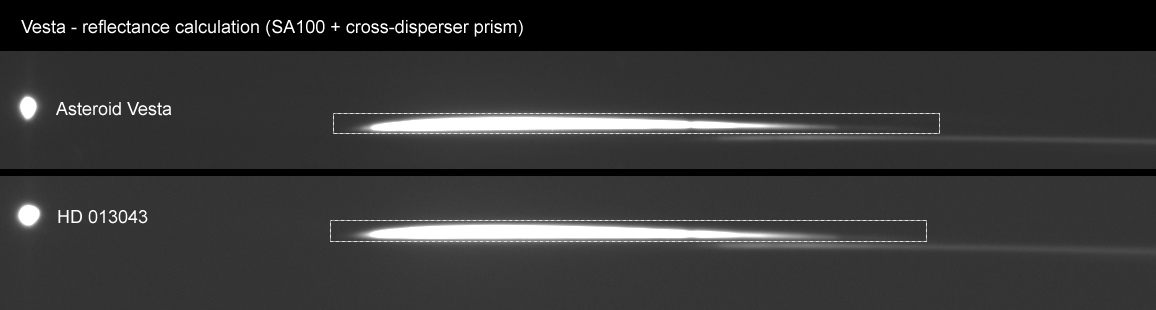
A pratical case: calculation of asteroid reflectance. I took spectra of Vesta and a solar type star (HD 013043, G2V, E(B-V)=0.007). Airmass was 1.20 and 1.40 respectively (I could not to do better).
Bidimensional spectra:
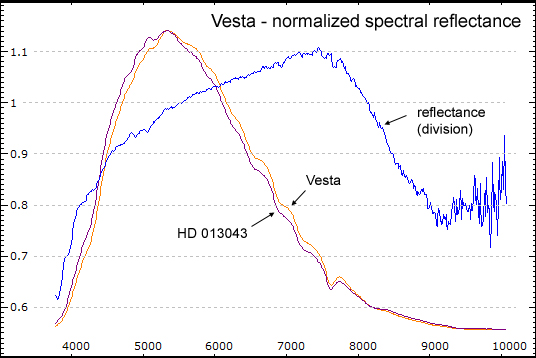
Profiles and reflectance curve, normalized at 5500A, obtained dividing Vesta by HD 013043 profiles (they are only wavelength calibrated, there is no need to correct for instrumental response).
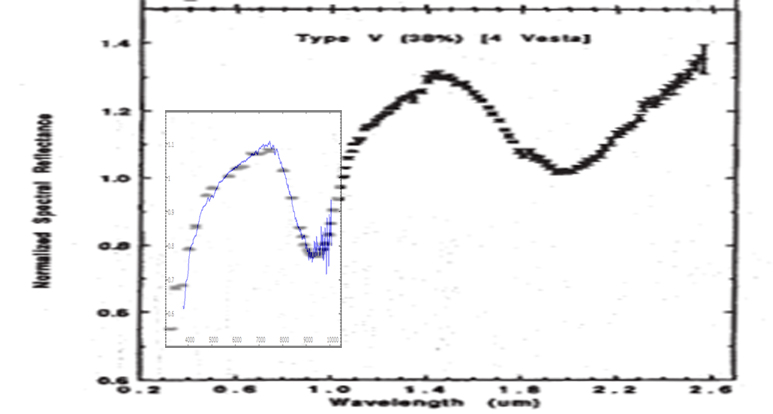
Result seems to be in good agreement with professional observation, as shown in this graph where I superimposed my calculated reflectance:
For similar works I think 1000 nm is to be considered a limit. At least on my setup I have no more signal from a G type star (for pratical case). As we can see, there is already a lot of noise in the final part of the curve.
The second idea. Analyzing the relationsheep between 1st and 2nd order spectrum and assuming constant the ratio of the relative efficiences, it could rebuild a "synthetic" second order spectrum from pure 1st order spectrum range (350-500 nm allows to correct up to 1000 nm), then subtract it from a normal spectrum to eliminate contamination.
So, analyze the two profiles. This is possible thanks to orders separation by the prism.
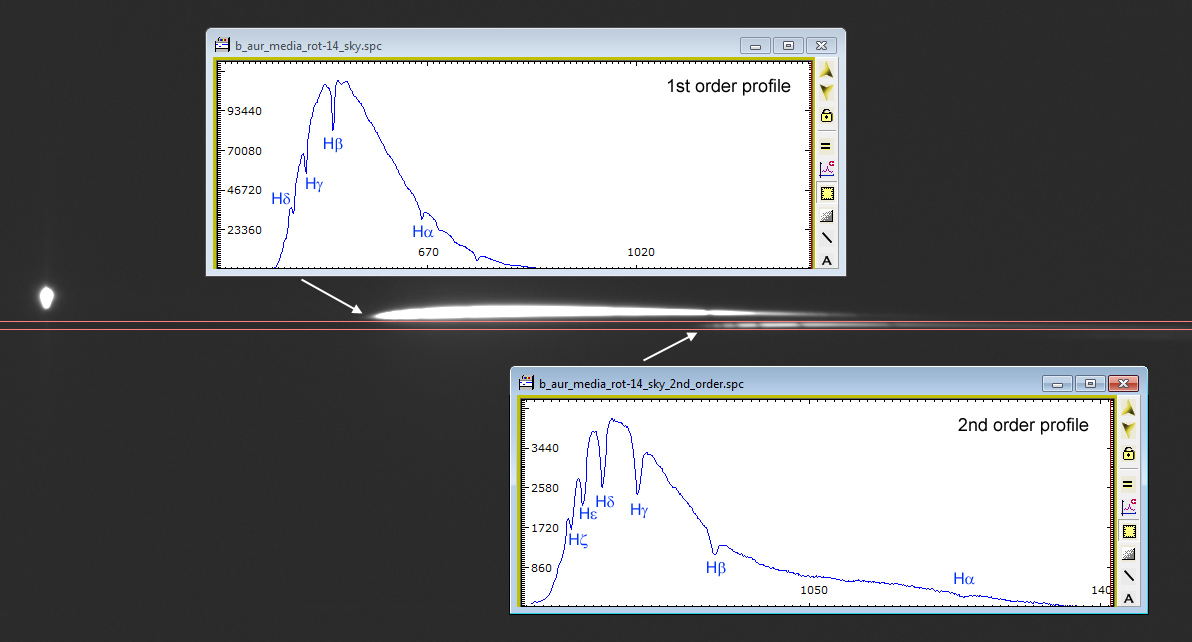
Note the scale (ADU count) for each profile and the very big difference of the efficiency per wavelength. Second order spectrum is not simply a rescaling of 1st order but his intensities are modulated by grating response (mainly for blaze angle). Is also noticeable the higher spectral resolution that allows to detect a greater number of Balmer lines.
For the following operation I used a spreadsheet. This is the ratio of intensities, 2nd order divided by 1st order (green line):
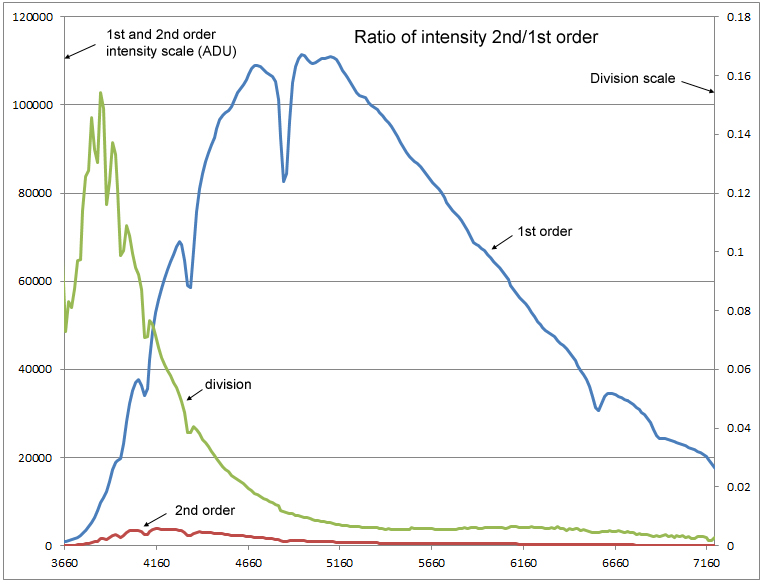
The division curve brings the effect of different spectral resolution, so it's better to consider a continuum fit. It may adjust the resolution before division by a spline filtering or, better, using an early type star spectrum that does not shows absorption lines.
Finally I try to remove the 2nd order contamination from a standard SA100 spectrum (without prism). After wavelenght calibration I multiplied the profile by ratio profile found previously. The result is a profile that should be very similar to the true 2nd order profile. Then I doubled all wavelength values to shift "synthetic" profile where the contaminant 2nd order spectrum should be. Final step is subtraction of synthetic 2nd order spectrum from contaminated profile. The "clean" profile is ready for flux calibration as usual.
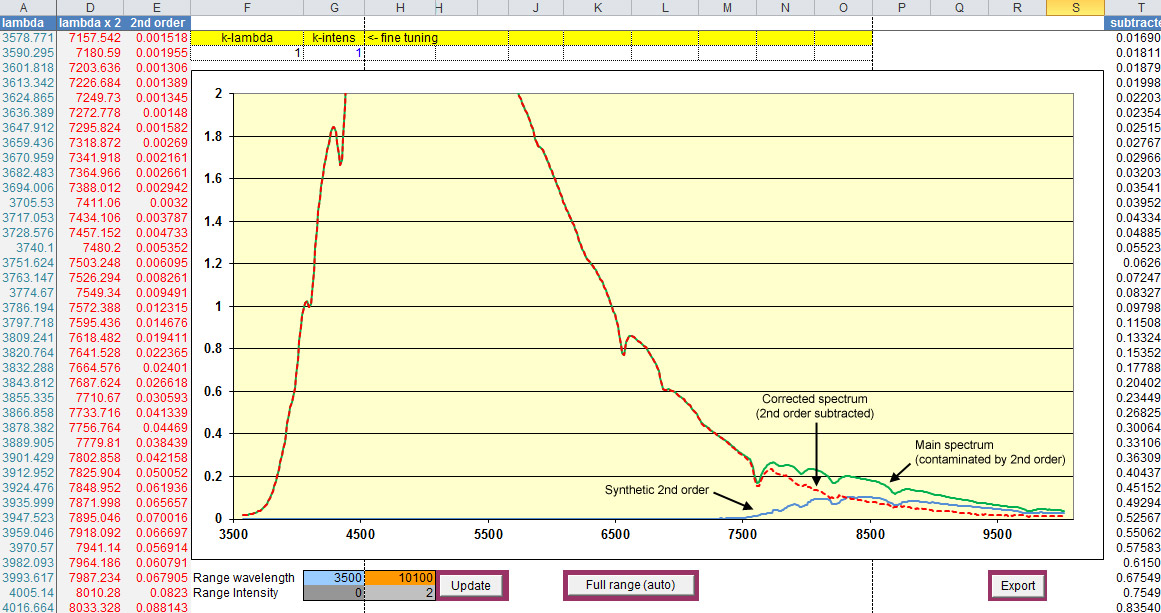
The procedure seems to work properly. It is very important to perform a precise wavelength calibration else spectral features don't match in IR part of spectrum (requires a shift before subtraction). It would remain the problem of different spectral resolution between 1st and 2nd order which makes the synthetic profile slightly different from true 2nd order.
I ask the more experienced than me if this is a method that one can take into account or hide problems that I have not considered. Assuming that the profile ratio between first and second order intensities is an instrumental constant and do not vary with grating models, I wonder if these simple operation can be usefully integrated in our spectral tools, for example enabling it by a checkbox.
I share separate first and second order spectrum profiles not normalized (with original ADU count) I extracted with SA100 and prism:
http://quasar.teoth.it/html/SA100/b_aur_1st_order.dat
http://quasar.teoth.it/html/SA100/b_aur_2nd_order.dat
Sorry for such a long post... but snowing and raining here for a long time!
Ciao
Paolo

