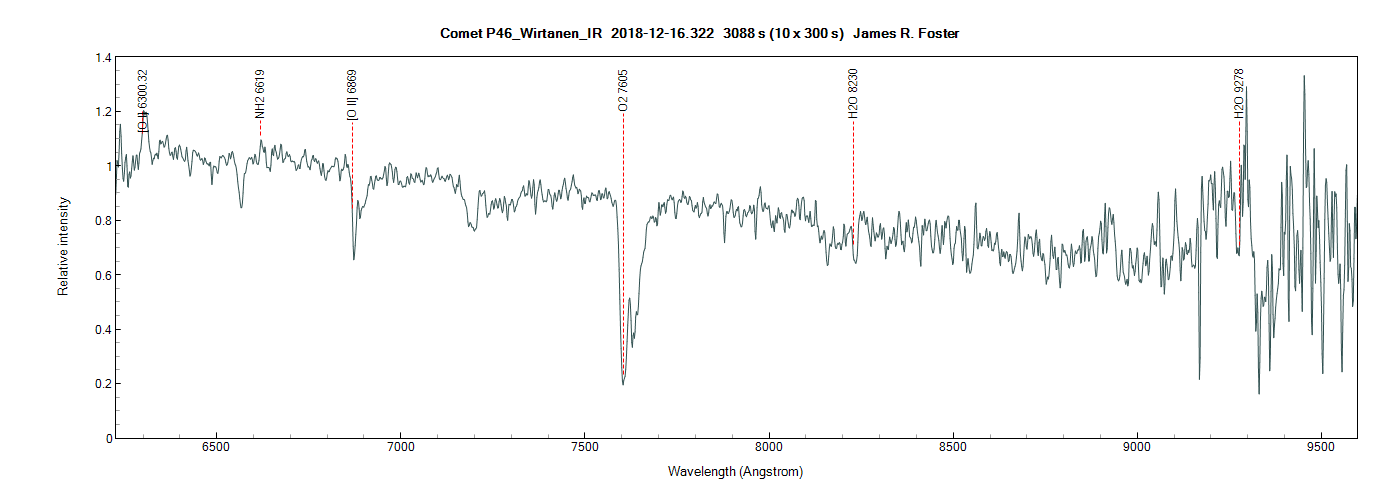
polluted backyard (less than 10 miles away from downtown Los Angeles- 12 million people in the County alone!). Here is the Alpy spectra I got after using the Miles
star HD19373 for my IR spectra:
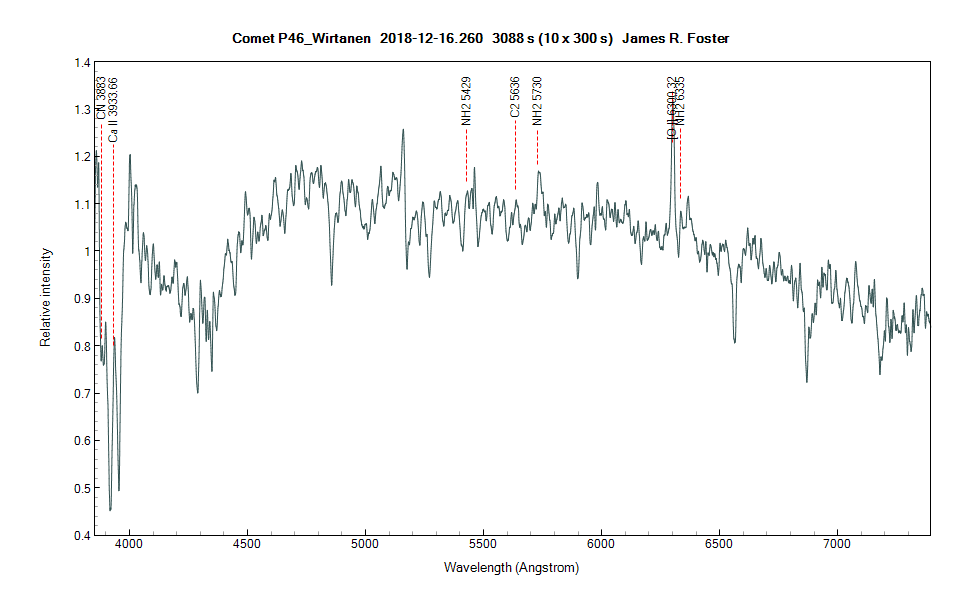
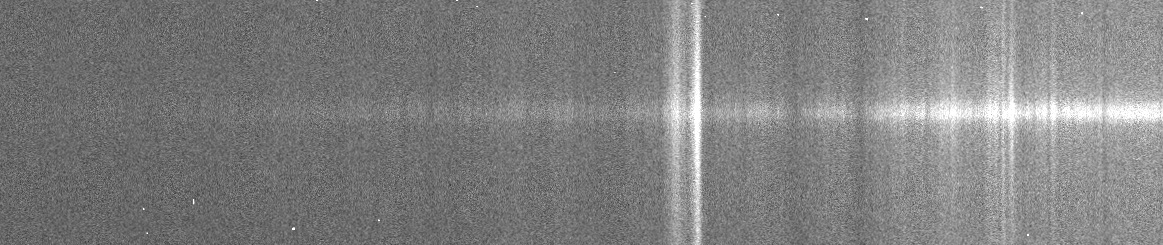
Here is the 2D of the spectra after processing it in IS:

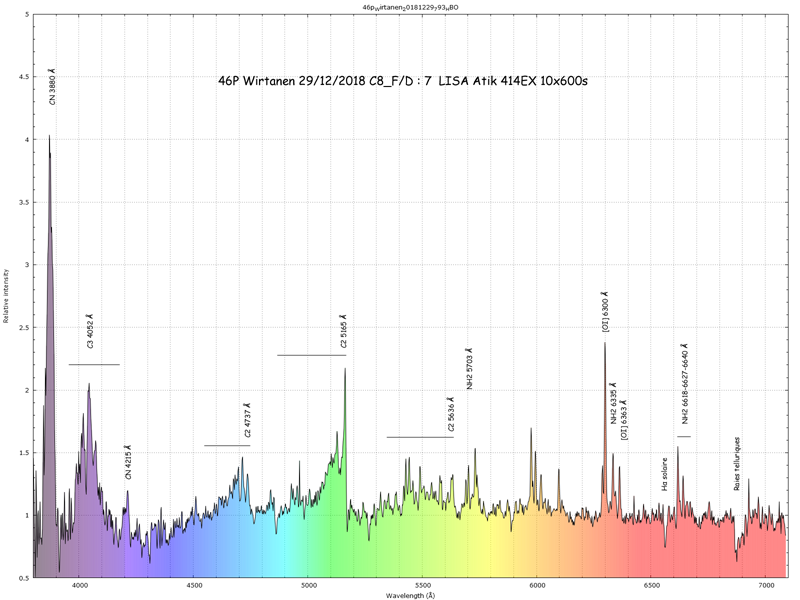
[Note: All identified spectral C and NH2 species speculative!]
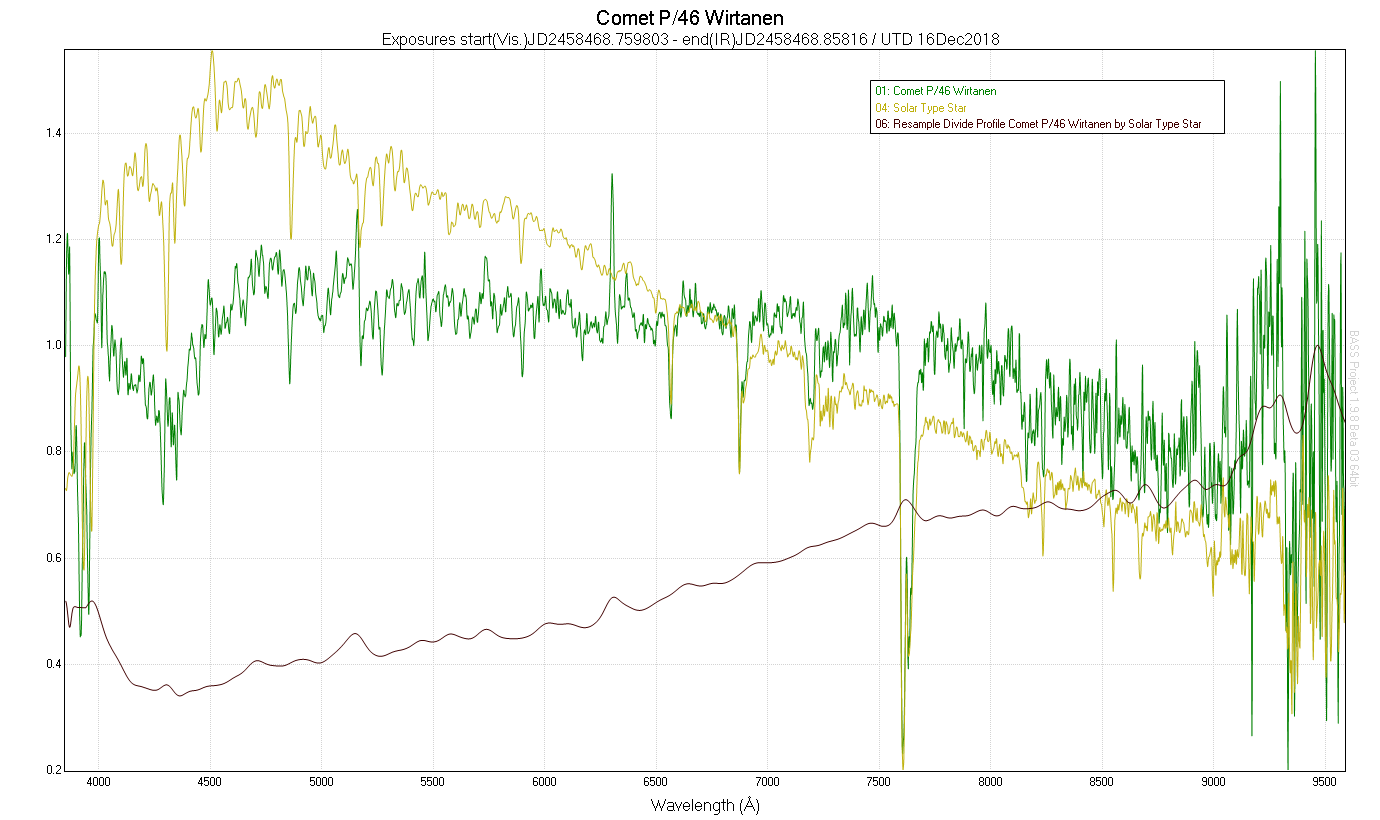
Finally, I tried to implement a spectra curve of the object with the light of the sun removed, as Robin demonstrated. I used the nearby solar analog star HD10307,
with a spectra type of G1V. Here is the resulting spectra graph (blue for the divided spectra):
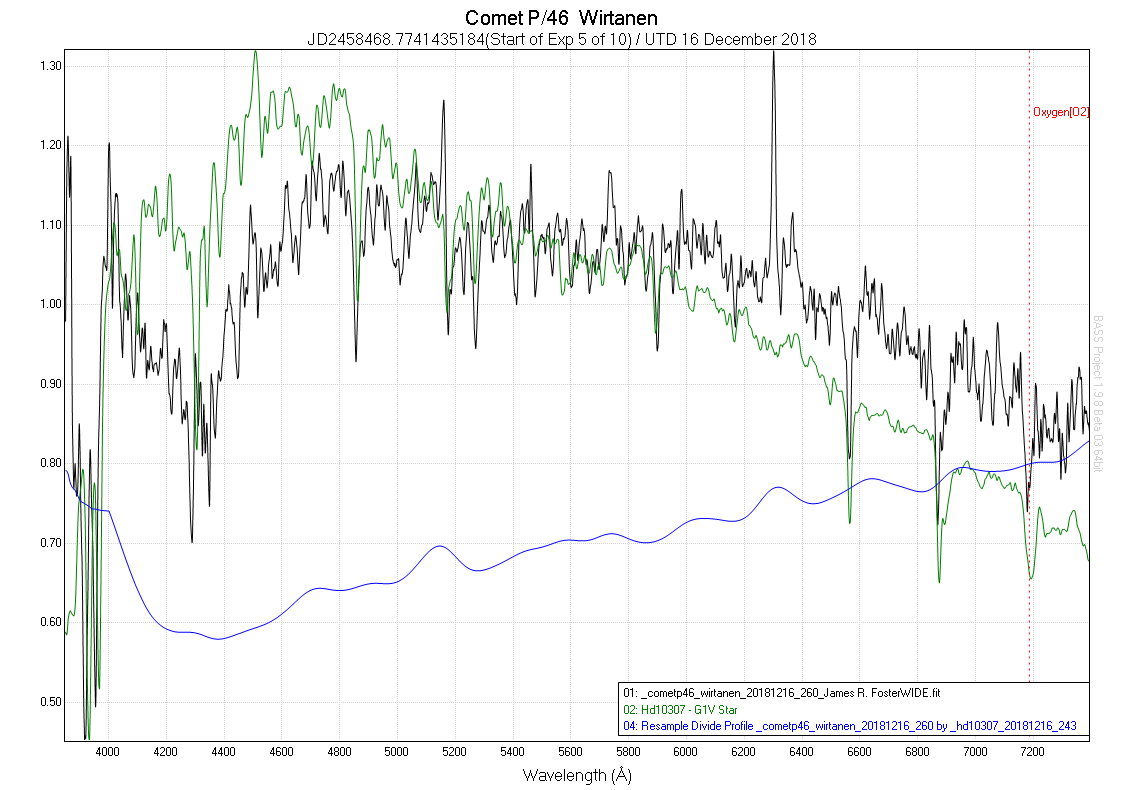
I'm sure this just represents the "dusty" area of the central pseudo-nucleus....I'll need to practice more IS to get only the gas emission component of the spectra.
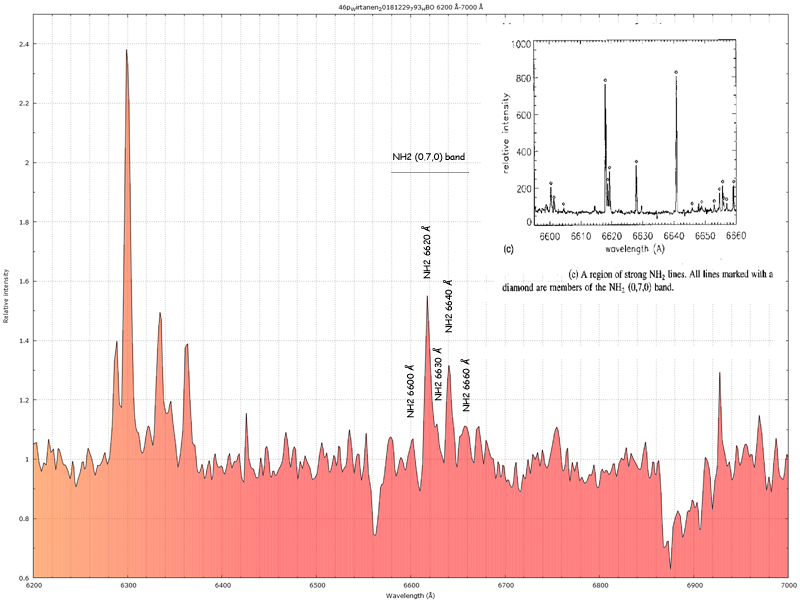
After taking these visual spectra, I quickly swapped the Alpy600 for my LISA in Infrared mode and got some spectra in the 6200-9600A region, which I still need
to process.
James