- v357lac_20190913_193_h_tlester.png (32.81 KiB) Viewed 17840 times
Call for monitoring Be stars in the TESS sectors
-
Tim Lester
- Posts: 168
- Joined: Fri Apr 04, 2014 6:31 pm
- Location: Arnprior Ontario
Re: Call for monitoring Be stars in the TESS sectors
Here is V357 Lac for Sept 13th. R = 14000 and I estimate the S/N to vary between about 80 to 120 over the range.
Tim
Tim
-
Benjamin Mauclaire
- Posts: 258
- Joined: Thu Sep 29, 2011 10:14 am
Re: Call for monitoring Be stars in the TESS sectors
Hello Tim,
Nice spectrum.
What spectroghraph are you using?
Benji
Nice spectrum.
What spectroghraph are you using?
Benji
Spcaudace spectroscopy software: saving you hundred hours of frustration.
-
Olivier GARDE
- Posts: 1276
- Joined: Thu Sep 29, 2011 6:35 am
- Location: Rhône Alpes FRANCE
- Contact:
Re: Call for monitoring Be stars in the TESS sectors
Here's a spectrum of V357 Lac taken last night with eShel spectrograph R=12000 (on H Alpha)
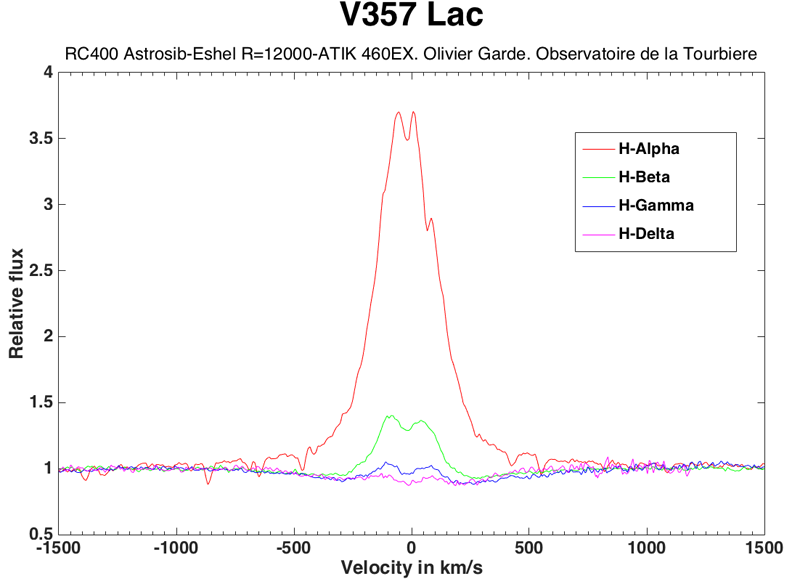
and a comparison with the 2 last spectra in Bess database
and a comparison with the 2 last spectra in Bess database
LHIRES III #5, LISA, e-Shel, C14, RC400 Astrosib, AP1600
http://o.garde.free.fr/astro/Spectro1/Bienvenue.html
http://o.garde.free.fr/astro/Spectro1/Bienvenue.html
-
J Labadie Bartz
- Posts: 46
- Joined: Mon Aug 26, 2019 5:12 pm
Re: Call for monitoring Be stars in the TESS sectors
Hi everyone,
Nice spectra of V357 Lac! Some interesting stuff here that I'll comment on while it's fresh in my mind.
- There is undoubtedly emission in the wings of some Helium lines, most notably He 6678 and He 5876. These emission peaks are at a large separation (up to ~400 km/s by eye) compared to all the other emission lines, and even compared to literature values of the stellar Vsini (~162 km/s according to http://vizier.u-strasbg.fr/viz-bin/Vizi ... BA/368/912 ). I'm not entirely sure how to interpret this, but it is definitely interesting.
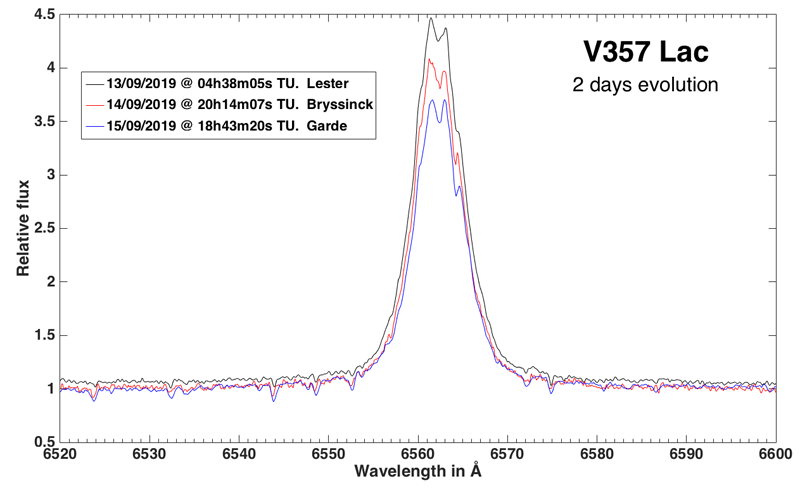
- The rapid decrease in the Halpha intensity relative to the continuum (from ~4.5 to ~3.5) as seen in Olivier's recent plot over just 2 days is dramatic. Perhaps this is a situation where the continuum flux is rapidly increasing, and so the line emission relative to the continuum appears to weaken. From most Be stars I know, it seems difficult for the Halpha emitting material to dissipate so quickly, but there are many cases where the nearby continuum flux can increase very quickly. Hopefully the TESS light curve can help here. This is actually a key aspect to having both spectra and photometry simultaneously- since the Halpha line is within the TESS photometric filter, if the Halpha emission increases it will cause the TESS brightness to increase (even if there is no increase in the continuum flux). On the other hand, if only the continuum flux in TESS increases, it will appear to cause the Halpha intensity (relative to the continuum level) to decrease. So it is essential to have both to properly interpret the variability.
Nice spectra of V357 Lac! Some interesting stuff here that I'll comment on while it's fresh in my mind.
- There is undoubtedly emission in the wings of some Helium lines, most notably He 6678 and He 5876. These emission peaks are at a large separation (up to ~400 km/s by eye) compared to all the other emission lines, and even compared to literature values of the stellar Vsini (~162 km/s according to http://vizier.u-strasbg.fr/viz-bin/Vizi ... BA/368/912 ). I'm not entirely sure how to interpret this, but it is definitely interesting.
- The rapid decrease in the Halpha intensity relative to the continuum (from ~4.5 to ~3.5) as seen in Olivier's recent plot over just 2 days is dramatic. Perhaps this is a situation where the continuum flux is rapidly increasing, and so the line emission relative to the continuum appears to weaken. From most Be stars I know, it seems difficult for the Halpha emitting material to dissipate so quickly, but there are many cases where the nearby continuum flux can increase very quickly. Hopefully the TESS light curve can help here. This is actually a key aspect to having both spectra and photometry simultaneously- since the Halpha line is within the TESS photometric filter, if the Halpha emission increases it will cause the TESS brightness to increase (even if there is no increase in the continuum flux). On the other hand, if only the continuum flux in TESS increases, it will appear to cause the Halpha intensity (relative to the continuum level) to decrease. So it is essential to have both to properly interpret the variability.
-
Robin Leadbeater
- Posts: 1957
- Joined: Mon Sep 26, 2011 4:41 pm
- Contact:
Re: Call for monitoring Be stars in the TESS sectors
Hi Olivier,Olivier GARDE wrote: and a comparison with the 2 last spectra in Bess database
The spectrum from 13th is normalised to a different level so the difference from 13th to 14th is probably exaggerated. My measurements (R~5500) do confirm a continuing decrease of approximately 0.8 A EW per day though. (If this trend continues the emission would disappear in approx 25 days)
Cheers
Robin
- hd212044_20190912-18_Leadbeater.png (23.92 KiB) Viewed 17684 times
LHIRES III #29 ATIK314 ALPY 600/200 ATIK428 Star Analyser 100/200 C11 EQ6
http://www.threehillsobservatory.co.uk
http://www.threehillsobservatory.co.uk
-
Robin Leadbeater
- Posts: 1957
- Joined: Mon Sep 26, 2011 4:41 pm
- Contact:
Re: Call for monitoring Be stars in the TESS sectors
Evolution of the 6678 He line for the same dates. (SNR ~150)
The maximum of red emission wing visible on 12th is shifted by ~200km/s relative to the absorption minimum
Robin
The maximum of red emission wing visible on 12th is shifted by ~200km/s relative to the absorption minimum
- v357lac_20190912-18_He_Leadbeater.png (39.79 KiB) Viewed 17675 times
LHIRES III #29 ATIK314 ALPY 600/200 ATIK428 Star Analyser 100/200 C11 EQ6
http://www.threehillsobservatory.co.uk
http://www.threehillsobservatory.co.uk
-
Christian Buil
- Posts: 1424
- Joined: Mon Sep 26, 2011 6:59 pm
- Contact:
Re: Call for monitoring Be stars in the TESS sectors
Comparison of two UVEX observations of V357 Lac (the 15.9 en 19.9 / 09 / 2019):
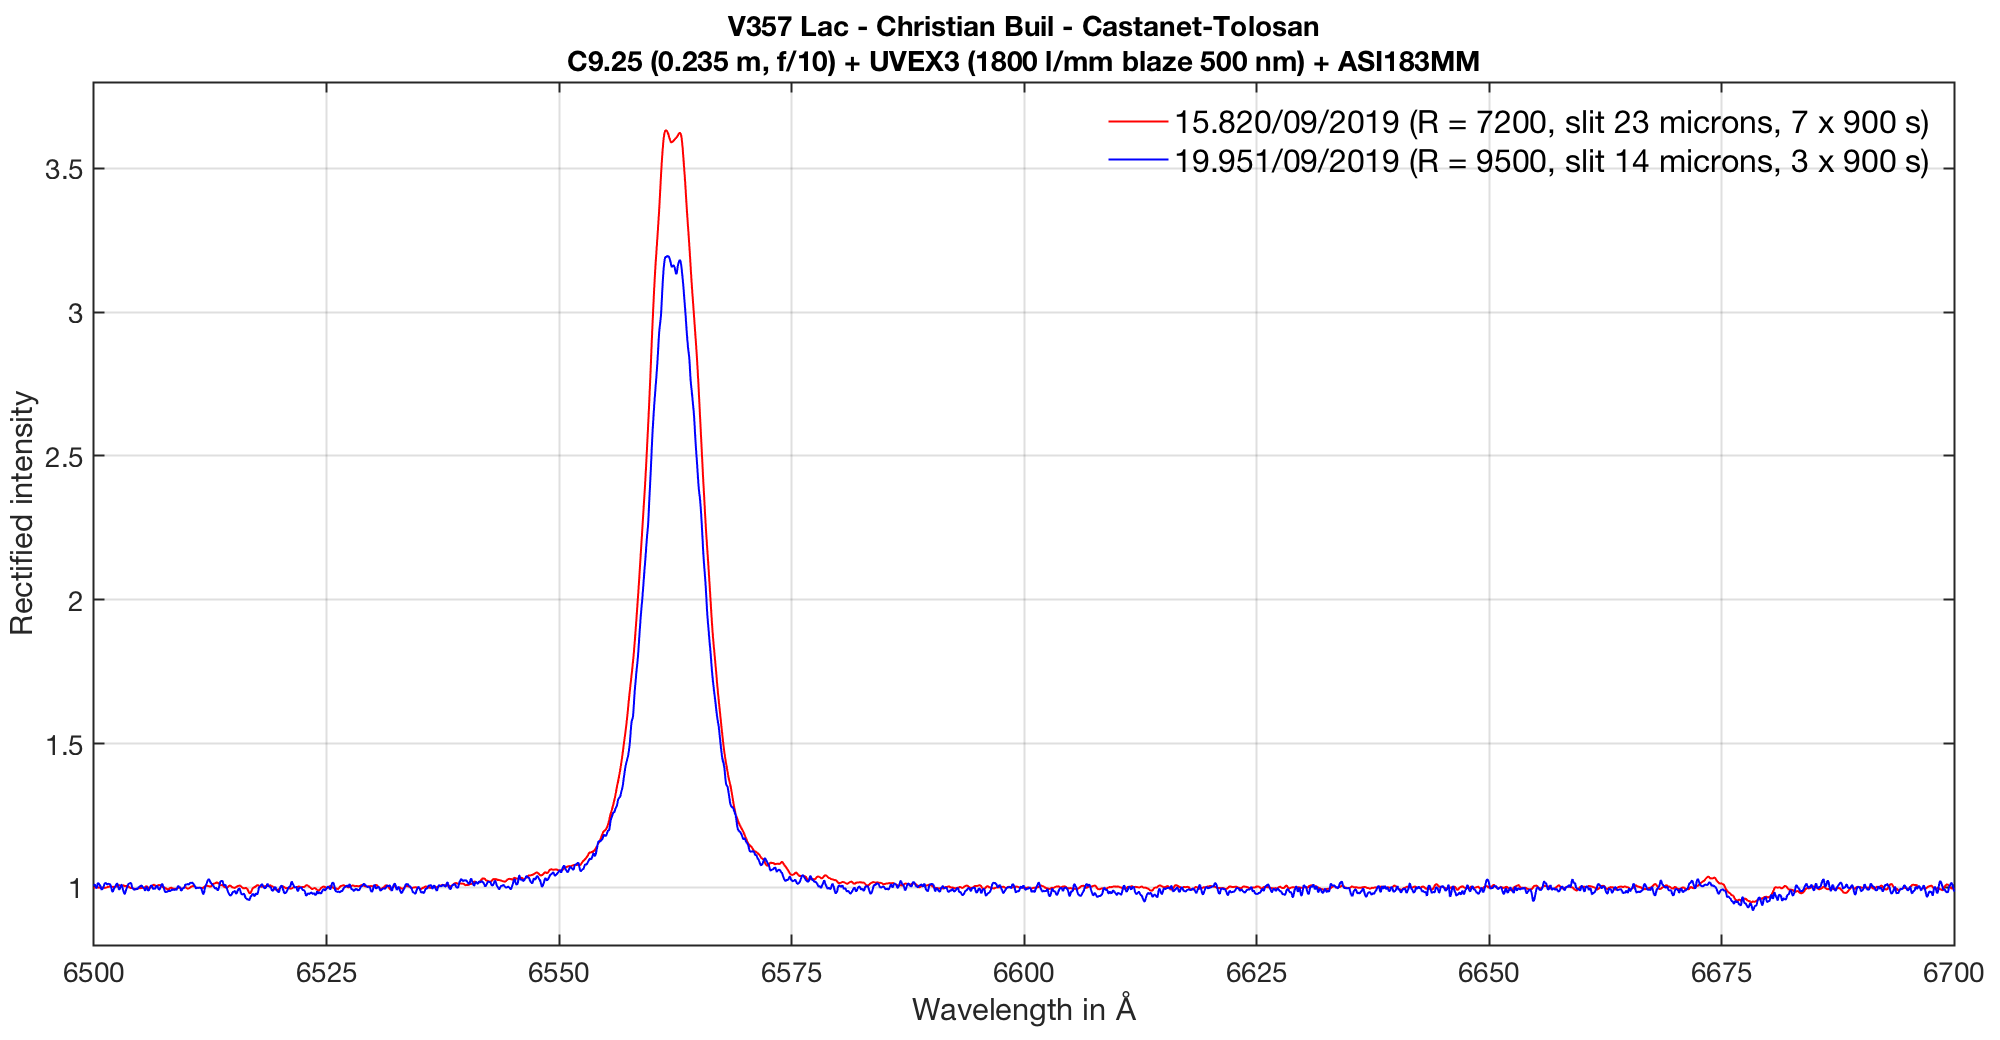
For a fine comparison of the profiles, the H2O telluric lines are removed and the continuum is rectified (normalization by a carfully fitted continuum). The Halpha evolution is very evident.
Christian
(note the R=9500 resolution of UVEX by using a 14 microns, not so far of a typical Lhires III 2400 l/mm 23 microns spectrograph)
-
James Foster
- Posts: 458
- Joined: Sun Jan 24, 2016 7:14 am
Re: Call for monitoring Be stars in the TESS sectors
Here is a 3-day span .gif animation of my Isis V5.93 processed LhiresIII data on 19,20, & 21 Sep19:
I made btw 9 and 12 x 900 second sub exposures with the Ha and He6778 bands at both ends of the continuum; a tight fit
with the 2400 l/mm grating!
The water vapour generating telluric lines varied btw dry/wet nights. Looks like the He portion shows definite oscillatory behavior in the span of 3-days.
I'll submit these to BeSS database today.
James
James Foster
eShel2-Zwo ASI2600MM Pro
Lhires III (2400/1800/600 ln/mm Grat) Spectroscope
LISA IR/Visual Spectroscope (IR Configured)
Alpy 200/600 with Guide/Calibration modules and Photometric slit
Star Analyzer 200
eShel2-Zwo ASI2600MM Pro
Lhires III (2400/1800/600 ln/mm Grat) Spectroscope
LISA IR/Visual Spectroscope (IR Configured)
Alpy 200/600 with Guide/Calibration modules and Photometric slit
Star Analyzer 200
-
James Foster
- Posts: 458
- Joined: Sun Jan 24, 2016 7:14 am
Re: Call for monitoring Be stars in the TESS sectors
Here is a 3-day animation of the spectrum of V0357 Lac taken around the He5875A line with my CDK17 and LhiresIII with the 2400 l/mm grating on 23,24, & 25 Sep 19:
I exposed between 2.5-3.5 hrs each night to get sufficient snr on this 7 v-mag object. Each spectra was purposely shifted to make the Na lines match their
laboratory values. The He5875A absorption shape seems steeper and narrower than figure under the He6678A absorption line. The nearby telluric Na lines
make spectral alignment between the various nights very easy and accurate. No heliocentric radial corrections were applied.
James
Last edited by James Foster on Thu Sep 26, 2019 12:40 am, edited 8 times in total.
James Foster
eShel2-Zwo ASI2600MM Pro
Lhires III (2400/1800/600 ln/mm Grat) Spectroscope
LISA IR/Visual Spectroscope (IR Configured)
Alpy 200/600 with Guide/Calibration modules and Photometric slit
Star Analyzer 200
eShel2-Zwo ASI2600MM Pro
Lhires III (2400/1800/600 ln/mm Grat) Spectroscope
LISA IR/Visual Spectroscope (IR Configured)
Alpy 200/600 with Guide/Calibration modules and Photometric slit
Star Analyzer 200
-
J Labadie Bartz
- Posts: 46
- Joined: Mon Aug 26, 2019 5:12 pm
Re: Call for monitoring Be stars in the TESS sectors
Hi everyone,
Great work with these observation! Very interesting to see the variability in the Helium lines in particular. I've been doing some more reading on the topic, and this is convincingly suggestive of ongoing and inhomogeneous mass ejection from the star (the He emission wings in particular). The other variability in the He line profile (not in the high velocity wings) could be from stellar pulsation distorting the surface of the star and/or some combination of emission/absorption from circumstellar material. Regardless, these lines are excellent tracers of what is happening very close to the star at the shortest timescales. This is exactly what I was hoping to see in this star.
I also read about an alternative hypothesis for the decreasing Halpha peak intensity. At the very beginning of an outburst, possibly something acts to decrease the amount of ionizing UV flux the disk receives (in short, less UV flux --> less line emission). This could be something in the photosphere, or perhaps recently ejected material blocks some UV flux from 'seeing' the rest of the disk. Anyway, I thought that was an interesting idea. The TESS data will tell us a lot about this, since it is sensitive to material in the very inner disk.
I still plan to use 75 hours of telescope time with the NRES echelle spectrograph to get ~5 spectra per night during the second and final TESS sector for this star (V357 Lac; sector 17; 2019-Oct-07 to 2019-Nov-02). However, the telescope that I have this time for is currently experiencing hardware problems. I really hope these are resolved ASAP. I am in touch with the on-site support staff and they are working on it, so all I can do is hope for the best right now. Regardless, this remains the most valuable target to monitor right now, and your spectra will be important in interpreting the signals we see in TESS.
I've been spending most of my time lately working on proposals for more telescope time for this project. All of your recent spectra from the list of TESS Be stars are great encouragement that this is a worthwhile endeavor.
Data for TESS sector 14 recently became available. Once these proposals are finished I will match the TESS light curves to the Be stars that have some spectroscopic coverage between 2019-Jul-18 to 2019-Aug-15 (when TESS sector 14 was observed), then I'll make the LC files and plots available to everyone.