Hello,
I apologize, the second picture in my last message the He ll 4685 position is wrong, you can see in this second graphic the exact position of this band.
So you can see too that there isn't any activity of He in this place on September 10th,but you can appreciate a little beginning on Sep. 12th.
Cheers, J. Guarro.
Alert! Nova Cas 2021 mag 9
-
Joan Guarro Flo
- Posts: 729
- Joined: Thu Nov 03, 2011 8:50 pm
Re: Alert! Nova Cas 2021 mag 9
- Attachments
-
- novacas20213.png (14.74 KiB) Viewed 19910 times
-
- novacas20214.png (23.05 KiB) Viewed 19910 times
-
Christophe Boussin
- Posts: 172
- Joined: Sun Aug 21, 2016 6:04 pm
Re: Alert! Nova Cas 2021 mag 9
Hello all,
A few days ago, data from the AAVSO website showed a new and very clear increase in the brightness of Nova Cas 2021...
The light curve shows that Nova Cas 2021 had a new maximum of luminosity around September 9-10 with a magnitude of about 6.5 !!
Since this date, the magnitude of the Nova is again at values comparable to those of early September...
Thanks to a sunny weather, I was able to follow the evolution of the Halpha line profile during this new maximum.
I obtained three new high resolution spectra of the Halpha line on September 11 at 21 h 47 TU (resolution of 18239, JJ = 2459469.4074, 12 x 600s), on September 12 at 21 h 17 TU (resolution of 16729, JJ = 2459470.3869, 6 x 600s) and on September 13 at 20 h 48 TU (resolution of 19614, JJ = 2459471.3668, 9 x 600s) with my LHIRES III (grating of 2400 lines / mm).
The set of my spectra obtained between August 27 and September 13 allows to see the global evolution of the Halpha line profile around the luminosity maximum :
The position of the peak at +785 km/s on September 2 and 4 is noted on this graph.
We can notice the decrease of the relative intensity of the top of the Halpha line during the increase of luminosity between September 4 and 9 then its increase during the decrease of luminosity since September 9-10.
Following this episode, the Halpha line has "fully recovered" a profile and a relative intensity very similar to early August.
The next graphs allow to see in more detail the evolution of this profile between August 27 and September 13 :
and its animation :
The return of rainy days forces me to take a break in this monitoring... I wish you all very clear skies !!
Christophe BOUSSIN
A few days ago, data from the AAVSO website showed a new and very clear increase in the brightness of Nova Cas 2021...
The light curve shows that Nova Cas 2021 had a new maximum of luminosity around September 9-10 with a magnitude of about 6.5 !!
Since this date, the magnitude of the Nova is again at values comparable to those of early September...
- Light curve of the Nova CAS 2021 (AAVSO)
I obtained three new high resolution spectra of the Halpha line on September 11 at 21 h 47 TU (resolution of 18239, JJ = 2459469.4074, 12 x 600s), on September 12 at 21 h 17 TU (resolution of 16729, JJ = 2459470.3869, 6 x 600s) and on September 13 at 20 h 48 TU (resolution of 19614, JJ = 2459471.3668, 9 x 600s) with my LHIRES III (grating of 2400 lines / mm).
The set of my spectra obtained between August 27 and September 13 allows to see the global evolution of the Halpha line profile around the luminosity maximum :
- Light curve (AAVSO) and Halpha line profile of the Nova CAS 2021 on August 27th, 31th and on September 2nd, 4th, 6th, 9th, 11th, 12th and 13th 2021
We can notice the decrease of the relative intensity of the top of the Halpha line during the increase of luminosity between September 4 and 9 then its increase during the decrease of luminosity since September 9-10.
Following this episode, the Halpha line has "fully recovered" a profile and a relative intensity very similar to early August.
The next graphs allow to see in more detail the evolution of this profile between August 27 and September 13 :
- Halpha line of Nova Cas 2021 on August 27th, 31th and on September 2nd, 4th, 6th, 9th, 11th, 12th and 13th 2021
- novacas2021_20210827_20210913_Christophe Boussin.png (52.93 KiB) Viewed 19850 times
- Halpha line of Nova Cas 2021 on August 27th, 31th and on September 2nd, 4th, 6th, 9th, 11th, 12th and 13th 2021 (zoom)
- novacas2021_20210827_20210913_zoom_Christophe Boussin.png (57.33 KiB) Viewed 19850 times
- Halpha line of Nova Cas 2021 from August 27th to September 13th 2021 (animation)
- novacas2021_20210827_20210913_Christophe Boussin.gif (77.79 KiB) Viewed 19850 times
Christophe BOUSSIN
CBO (Newton 200 F/5 / Alpy600 / Atik 314L+ / Atik Titan + Mewlon 180 F/12 / LHIRES III 2400 / Atik 460EX / Atik 314 L+) @ ARAS database
-
Peter Somogyi
- Posts: 420
- Joined: Sun Jul 13, 2014 8:56 am
Re: Alert! Nova Cas 2021 mag 9
Nice serie, Christophe!
Let me extend yours with my time serie (exceptional weather):
All normalized for the 6520-6530A range.
Cheers,
Peter
Let me extend yours with my time serie (exceptional weather):
- H-alpha at R~17000
- NovaCas2021_0902_0912.png (56.82 KiB) Viewed 19817 times
Cheers,
Peter
-
Wolfgang Vollmann
- Posts: 2
- Joined: Thu Jul 08, 2021 10:12 am
Re: Alert! Nova Cas 2021 mag 9
Hi all,
great work you are doing here on the Nova!
I follow the brightness changes with a DSLR camera using 3-color photometry in RGB. My measures are available in AAVSO database (VOL).
Very interesting are the changes in color index green minus red which follow the brightness changes of the Nova quite closely. Near the bright maxima the color index is smallest (around +0.3..0.4mag), near the minima largest (+0.9mag). I attach the 2 diagrams with same timescale. TG = Tri-Color Green magnitude, TR = Tri-Color Red magnitude.
Am I right to interpret the changing intensity of the H-alpha emission relative to continuum causing this color index changes?
What drives these changes?
Best regards
Wolfgang Vollmann
- Attachments
-
- Abb1_Nova_Cas_2021_Lichtkurve_Farbindex.png (107.27 KiB) Viewed 19722 times
-
Christian Buil
- Posts: 1432
- Joined: Mon Sep 26, 2011 6:59 pm
- Contact:
Re: Alert! Nova Cas 2021 mag 9
The appearance of nova Cas 2021, the September 28, 2021 with a Newton 200 mm f/5 and the Star'Ex spectrograph operated in low resolution (R = 2200) - 24 x 40 s exposure:
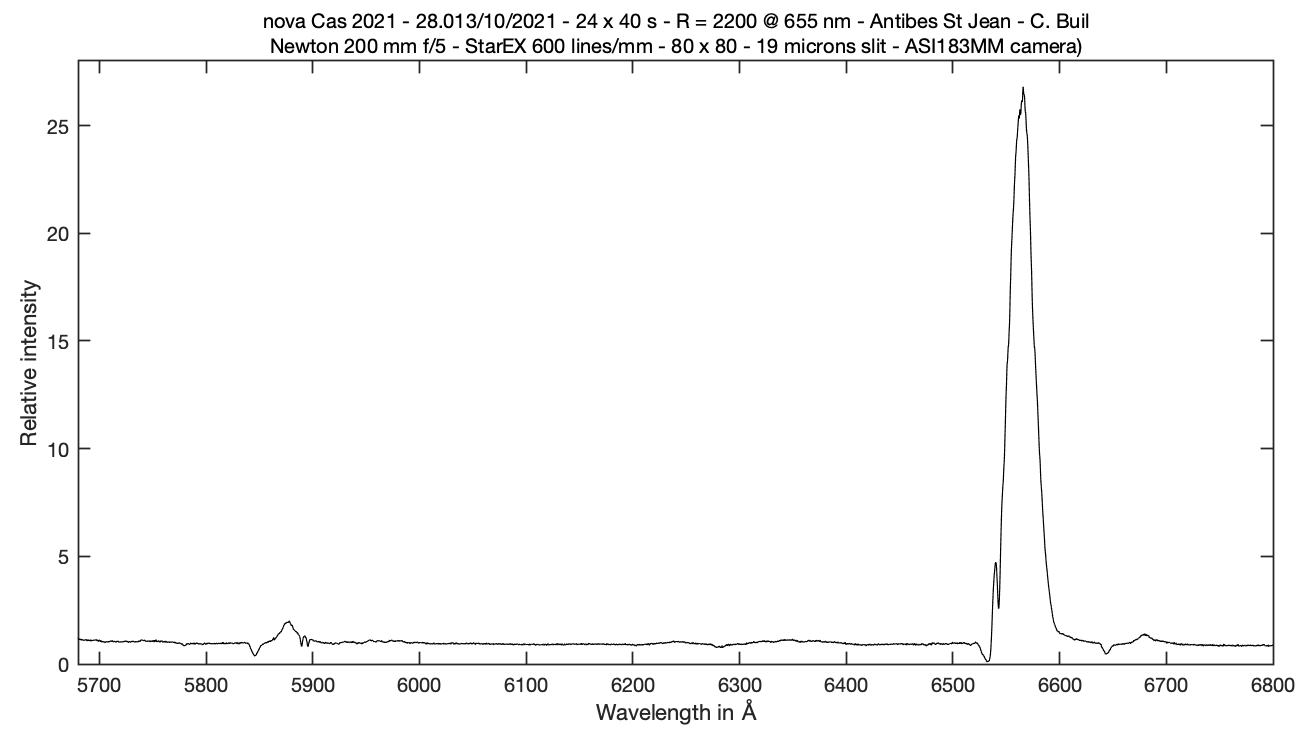
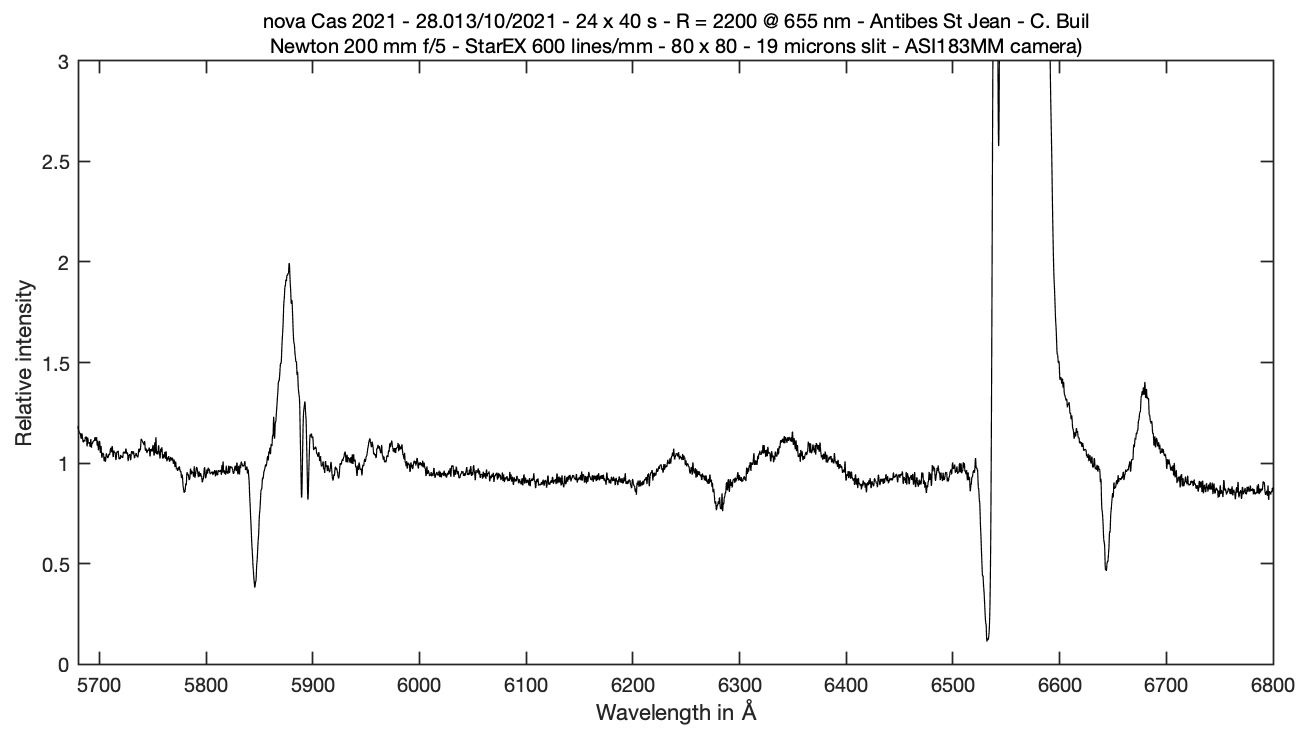
A description of the spectrograph setup is here (part 4.4): http://www.astrosurf.com/solex/sol-ex-stars-en.html
... and a video (!) of this observation (in French sorry), which also shows some tips for spectra calibrating:https://youtu.be/5nKucBo9Fys
Christian Buil
A description of the spectrograph setup is here (part 4.4): http://www.astrosurf.com/solex/sol-ex-stars-en.html
... and a video (!) of this observation (in French sorry), which also shows some tips for spectra calibrating:https://youtu.be/5nKucBo9Fys
Christian Buil
-
Benjamin Mauclaire
- Posts: 258
- Joined: Thu Sep 29, 2011 10:14 am
Re: Alert! Nova Cas 2021 mag 9
Hello Christian,
J'aime l'aspect très pédagogique de ta vidéo.
Cheers
J'aime l'aspect très pédagogique de ta vidéo.
Cheers
Spcaudace spectroscopy software: saving you hundred hours of frustration.
-
Christian Buil
- Posts: 1432
- Joined: Mon Sep 26, 2011 6:59 pm
- Contact:
Re: Alert! Nova Cas 2021 mag 9
Merci Benji !
Christian
Christian
-
Dubreuil Pierre
- Posts: 206
- Joined: Sat Oct 01, 2011 12:34 pm
Re: Alert! Nova Cas 2021 mag 9
Nova Cas 2021 très rouge !
Hier soir météo enfin favorable !
UVEX(4) poussé dans l'infrarouge jusqu'à 10000A !
Fente claire 25µ, RC8, plus aucun bout de verre !
Pierre
Hier soir météo enfin favorable !
UVEX(4) poussé dans l'infrarouge jusqu'à 10000A !
Fente claire 25µ, RC8, plus aucun bout de verre !
- Nova Cas 2021 IR
- _novacas2021_20210929_872_Pierre Dubreuil.png (10.23 KiB) Viewed 19430 times
-
HughAllen
- Posts: 61
- Joined: Mon Mar 23, 2015 7:17 pm
- Location: The Mendip Hills, 15 miles south of Bath, UK
Nova Cas 2021 absorption velocity variation
I have continued to follow the evolution of the expansion velocity, using the blue shifted absorption minimum on the shoulder of many of the emission lines. At the resolution of my Alpy 600 spectroscope, such P Cygni profiles have remained strong for all of the Balmer lines Hβ and above. In Hα and HeI (5876Å) there have been brief periods of disappearance whilst the P Cygni profile on the FeII (5169Å) emission was not observable for much longer periods, particularly during August and early September. When observable the FeII (5169Å) absorption velocity has almost always been the lowest. On a given date the velocity sequence in the other lines has been quite variable but the overall trend in absorption velocity shows an inverse link to the Vmag of the nova:
Here is the latest spectrum in the sequence, with markers at the rest wavelengths of the emission lines monitored in this study:
Cheers
Hugh
- novacas2021_101021.png (32.29 KiB) Viewed 18950 times
Hugh
Hugh Allen
Alpy 600 user
Alpy 600 user
-
Joan Guarro Flo
- Posts: 729
- Joined: Thu Nov 03, 2011 8:50 pm
Re: Alert! Nova Cas 2021 mag 9
Hello,
You can see here a comparison details in the blue.
Cheers, J. Guarro.
You can see here a comparison details in the blue.
Cheers, J. Guarro.
- Attachments
-
- NOVA CAS 2021 COM.png (20.27 KiB) Viewed 18902 times
-
- NOVA CAS 2021 COM2 .png (17.76 KiB) Viewed 18902 times