Hello all,
a while ago I suggested to look at H-alpha intensity in flux calibrated spectra. This has been done in the meantime by Robin. Christian has advanced the technique of absolute flux calibration to a new standard. If no flux calibrated spectra are available one can do an absolute flux calibration if the magnitude mV is known.
The procedure is the reverse as described by Christian for the determination of magnitude from a flux calibrated spectrum:
http://www.astrosurf.com/buil/calibrati ... ration.htm
With the help of ISIS the calibration is actually quite simple.
- Load a spectrum calibrated in relative flux.If a reference star nearby has been used for the instrument response this eliminates also the atmospheric extinction.
- Multiply it with Bessell V response function. This closely resembles the function of a Johnson V filter which is used by AAVSO
- Integrate the relative flux with the FWHM tool in ISIS. The spectral range of the spectrum should be from 4700 to 7300 A.
I0 = integral[Bessell_V(lambda)*F0(lambda)*dlambda] is the integrated relative flux:
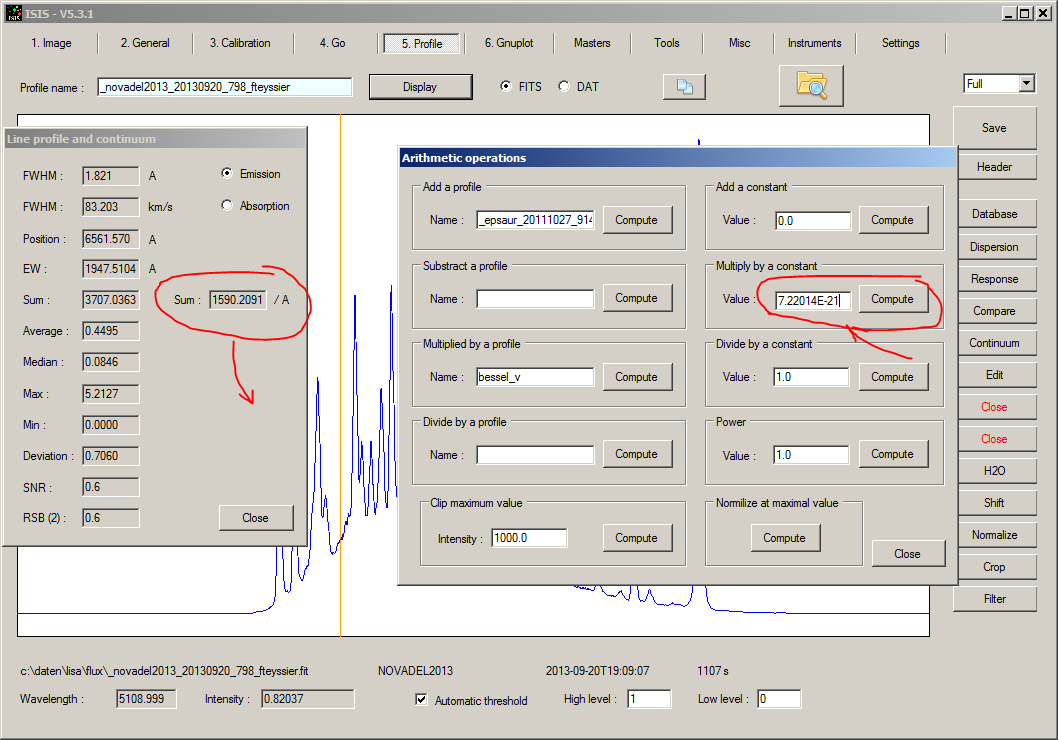
- calculating I0
- flux calculation3.PNG (71.09 KiB) Viewed 88219 times
- Calculate the calibration factor with the following equation:
F(lambda) = F0(lambda)/integral[Bessell_V(lambda)*F0(lambda)*dlambda]*10^[- 0.4*(mV + 13.70)]
Here F0 is the relative flux
The integral has been computed in the step before
mV is the measured V magnitude taken from e.g. AAVSO database or an independent measurement
13.70 is a constant to convert the magnitude to the flux in the Landolt system. It was determined by comparing the flux and magnitude of stars in the Calspec database. It is valid for all spectral classes.
- Reload the original spectrum and multiply it with the calibration factor
C = 1/I0*10^[- 0.4*(mV + 13.70)]
- Save the spectrum with _flux appended.
It would be nice if this sequence of operations could be implemented in ISIS (There is a flux calculation from magnitude V, by taking the value of the spectrum at 5556 A, but this is only valid for regular spectra, not for Novae or emission line spectra etc)

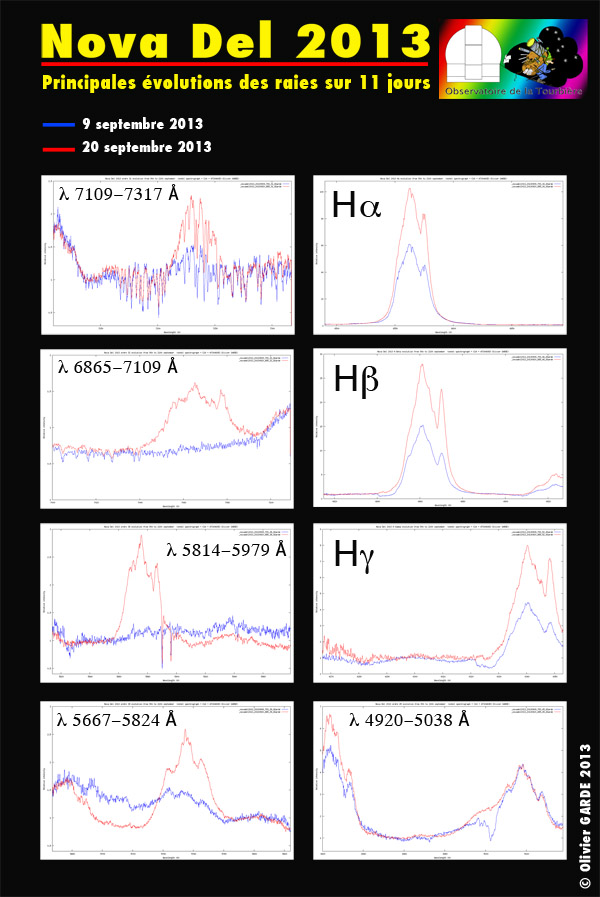
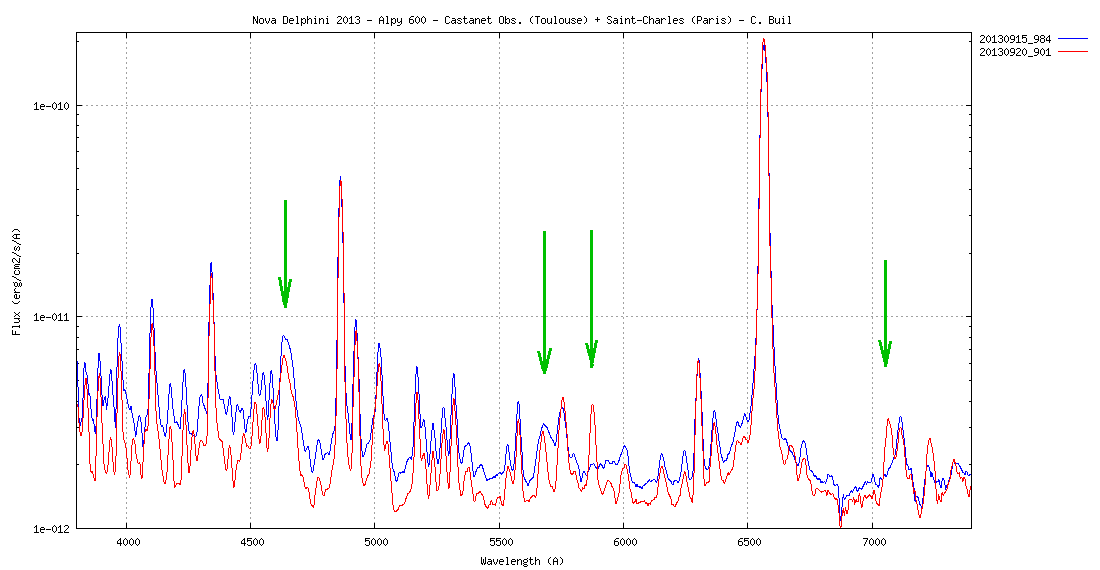
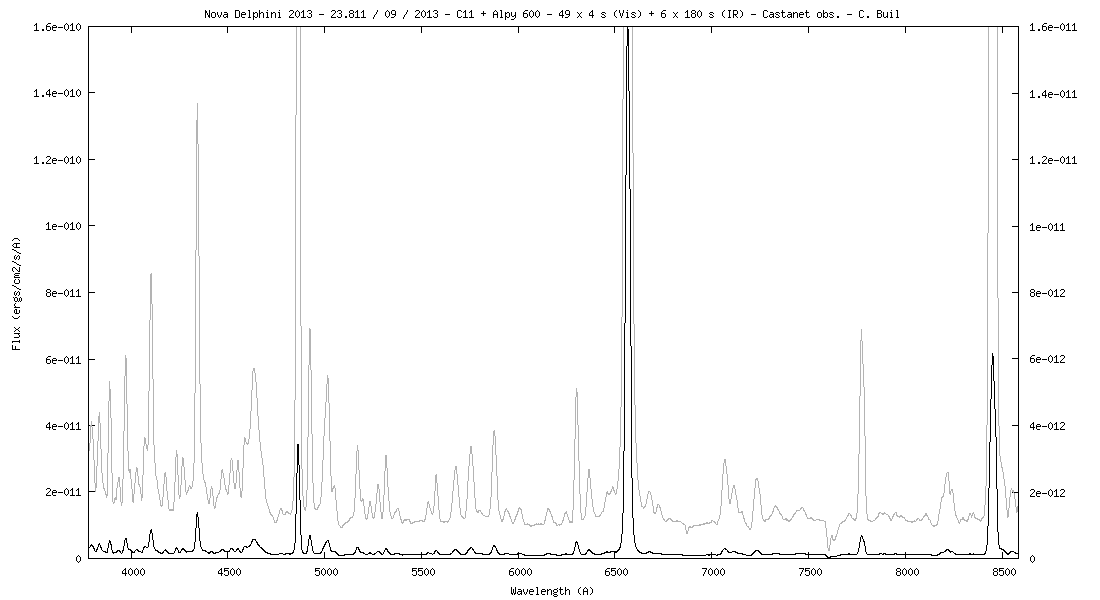
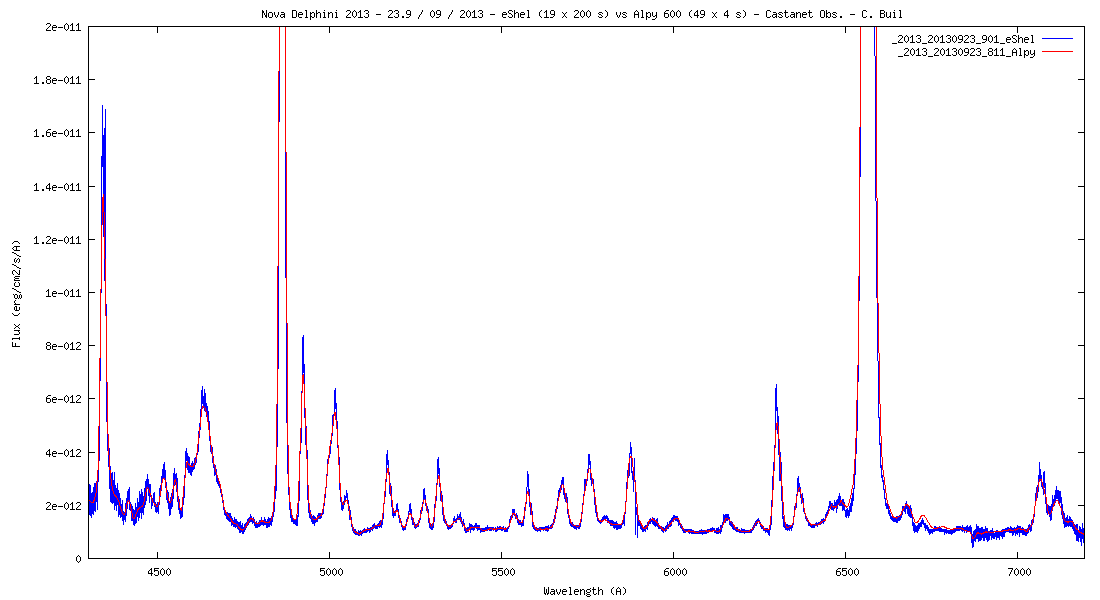
For the following animation, spectra of ALPY and LISA spectrographs from the of the Nova database:
http://www.astrosurf.com/aras/Aras_Data ... l-2013.htm
have been used, with spectra from Olivier Thizy, who recorded the first days continuously, supplemented with spectra from Jim Edlin and Francois Teyssier for the gaps, with spacings of one day in the beginning and 2 to 3 days in the later phases.
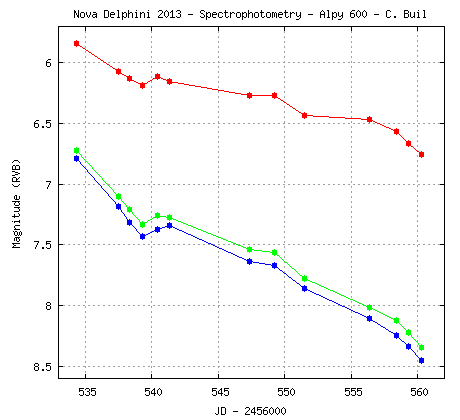
Notice that spectra taken with different instruments, different observers, different weather conditions have been used, so some imperfections are visible. But despite this it shows that the method works. The magnitudes mV have been obtained by eye from averaging the AAVSO observations over one day bins, rounded to 1/10 mag. Of course the absolute flux is only as good as these measurements. The relatively large scatter of individual AAVSO measurements may come from the fact that not everybody uses the correct CCD filter combinations, which is not so important for regular stars but especially important in the case of strong emission lines like H-alpha.
Of course it would be an advantage if all measurements would be taken with the same equipment, same reference star and same photometric equipment with correct spectral response.
These files were renamed and animated with the ISIS animation tool.
The use of a log scale has the following advantages:
- It allows to show large intensity variations over three orders of magnitude (especially if spectra will be added with a decrease of Nova intensity).
- Both the continuum and the H-alpha peak are shown with good detail.
- a constant S/N shows as a constant amplitude, irrespective of intensity of the signal.
- the ratio of line intensity is shown as a constant difference in height. This is particularly well visible for the Balmer series in the later stages, but also for other line groups.
- animated sequence of flux calibrated spectra of Nova Del 2013, log scale, corrected!!!
- @NovaDel_long2_.gif (576.22 KiB) Viewed 88203 times
The log scale was produced by modifying std.gnu:
set ylabel "flux [erg/cm^2/sec/A]" # added MD
set grid
set mxtics 5
set mytics 5 # added MD
set grid ytics mytics xtics # added MD
set logscale y # added MD
The details of the spectra and the actual calculation of C can be found in the attached ZIP file.
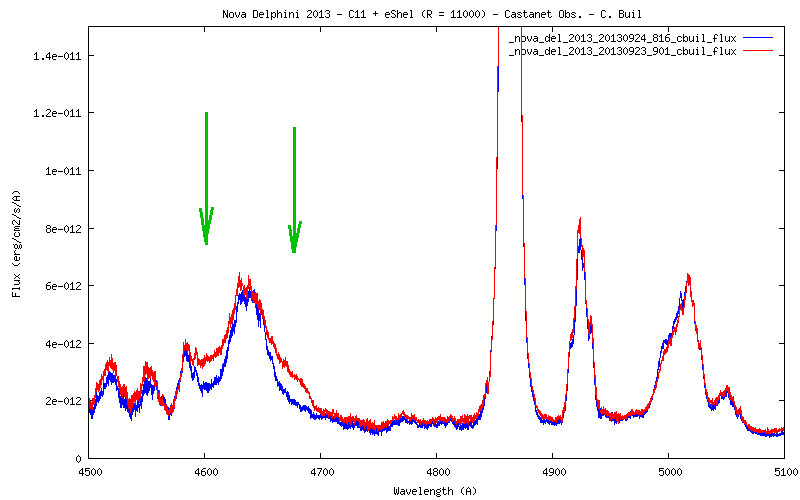
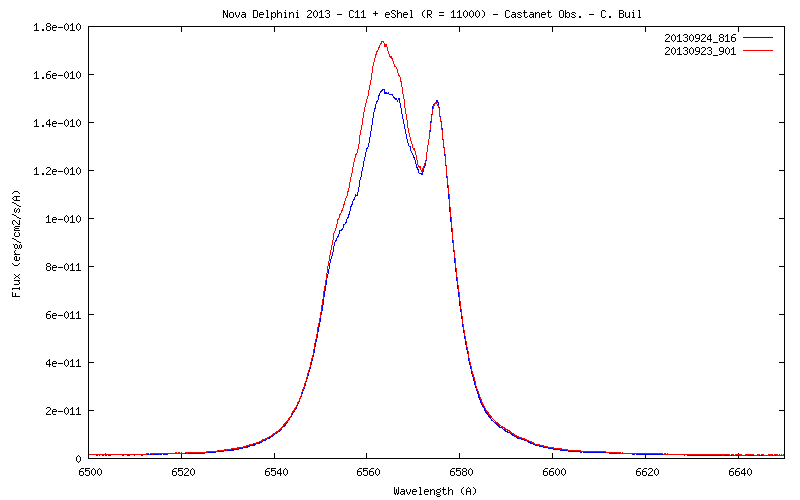
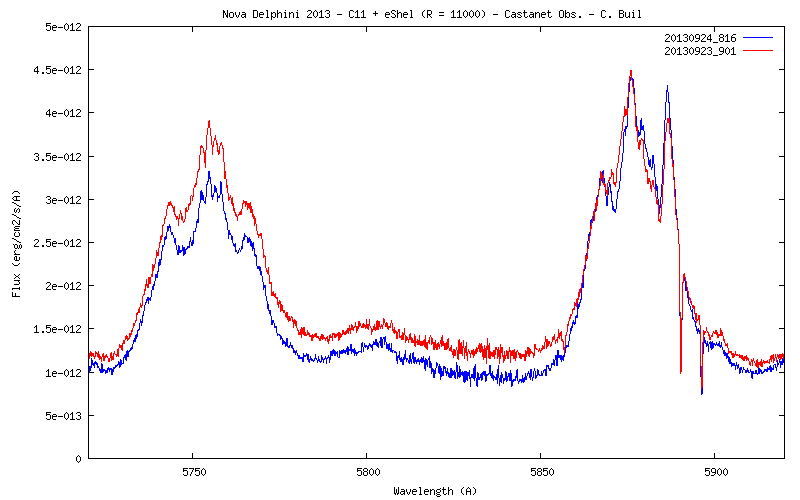
Once the spectra are flux calibrated, the physics of the Nova can be studied by plottting the flux of different lines as a function of time etc.
The good thing: everything except the calculation of the calibration factor can be done in ISIS, even the log scaling of the flux. Thanks, Christian

Regards, Martin