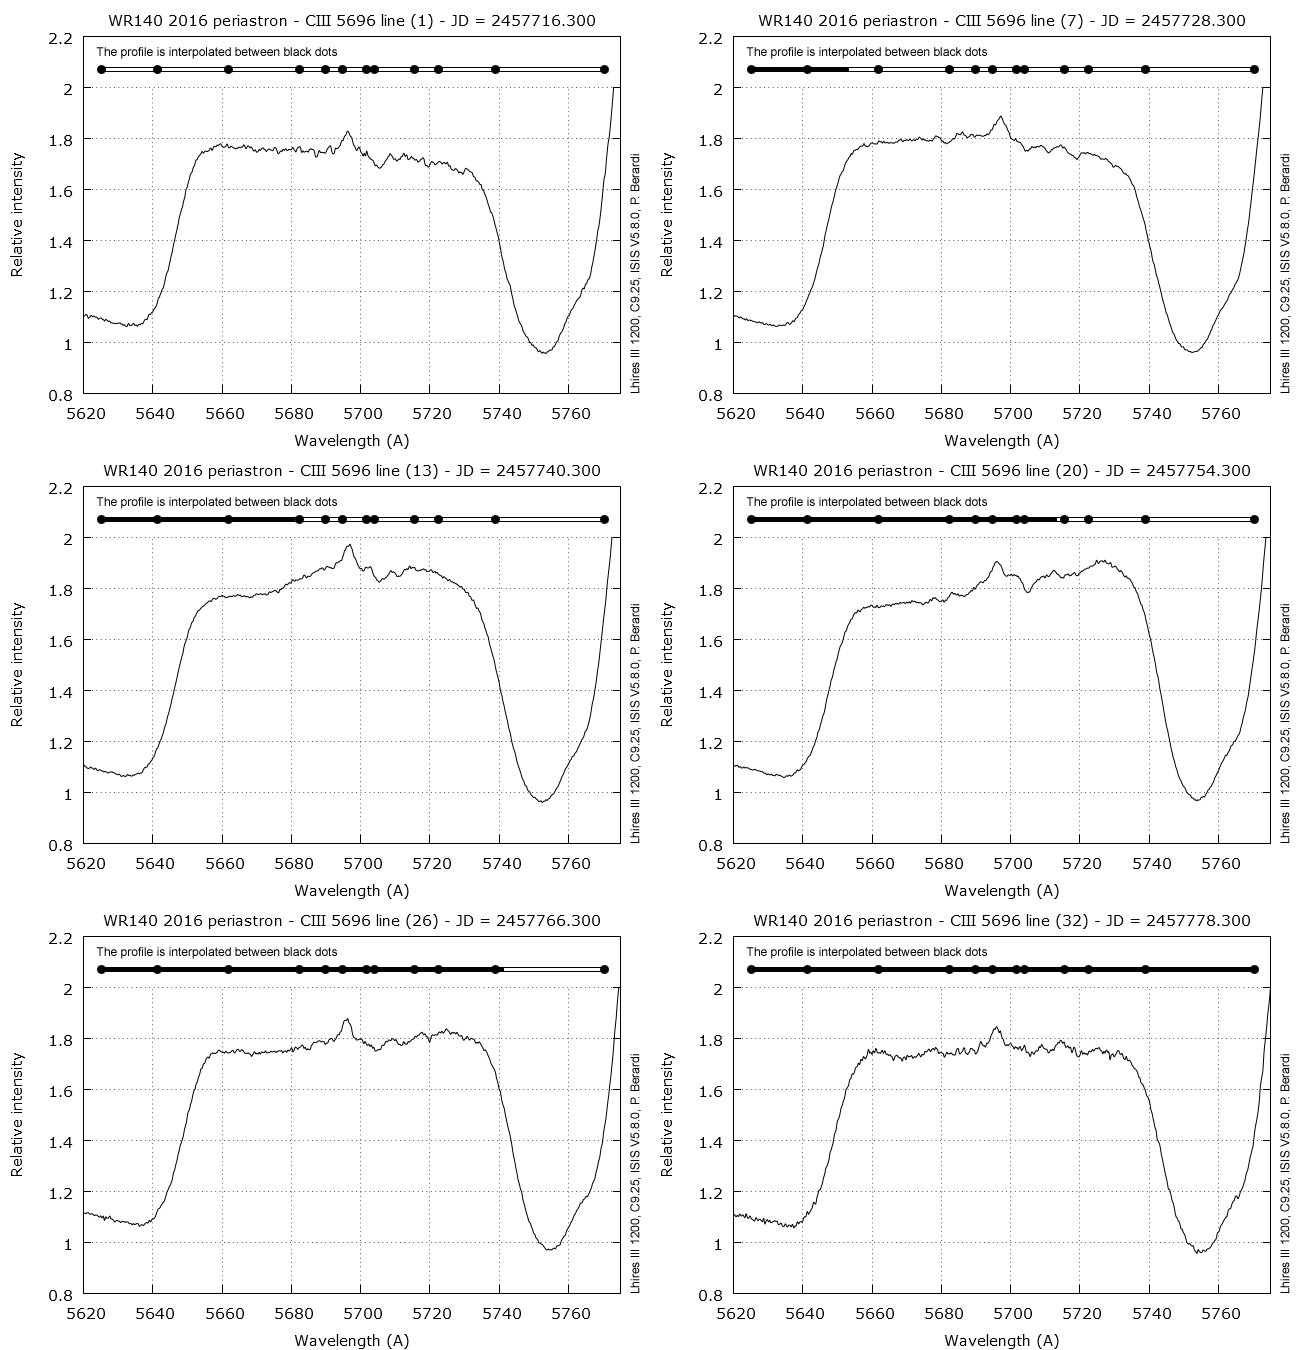
As we have seen for other animations and profile comparisons in this thread, the excess emission move from the blue side toward the red side of the flat top CIII 5696 line during the periastron passage, reflecting the shock cone radial velocity development:
http://www.roe.ac.uk/~pmw/Wr140orb.htm
(dash-dotted straight line is the our line of sight)
Radial velocity extent is very large, perhaps I should have used RVs instead of Angstroms for the abscissa graph.
Paolo