Page 3 of 6
Re: C2014Q2
Posted: Mon Jan 12, 2015 7:30 am
by Francois Cochard
Hello all,
Last Saturday, I made a spectrum of the comet, with my Alpy spectro.
Of course, nothing comparable with your great data, but my observation was made in city center, from the balcony of my appartment !
I only can see a small part of the sky - but luckily, this time the comet was in my small window !
I've also made a spectrum of the sky background, to remove it from the comet one.
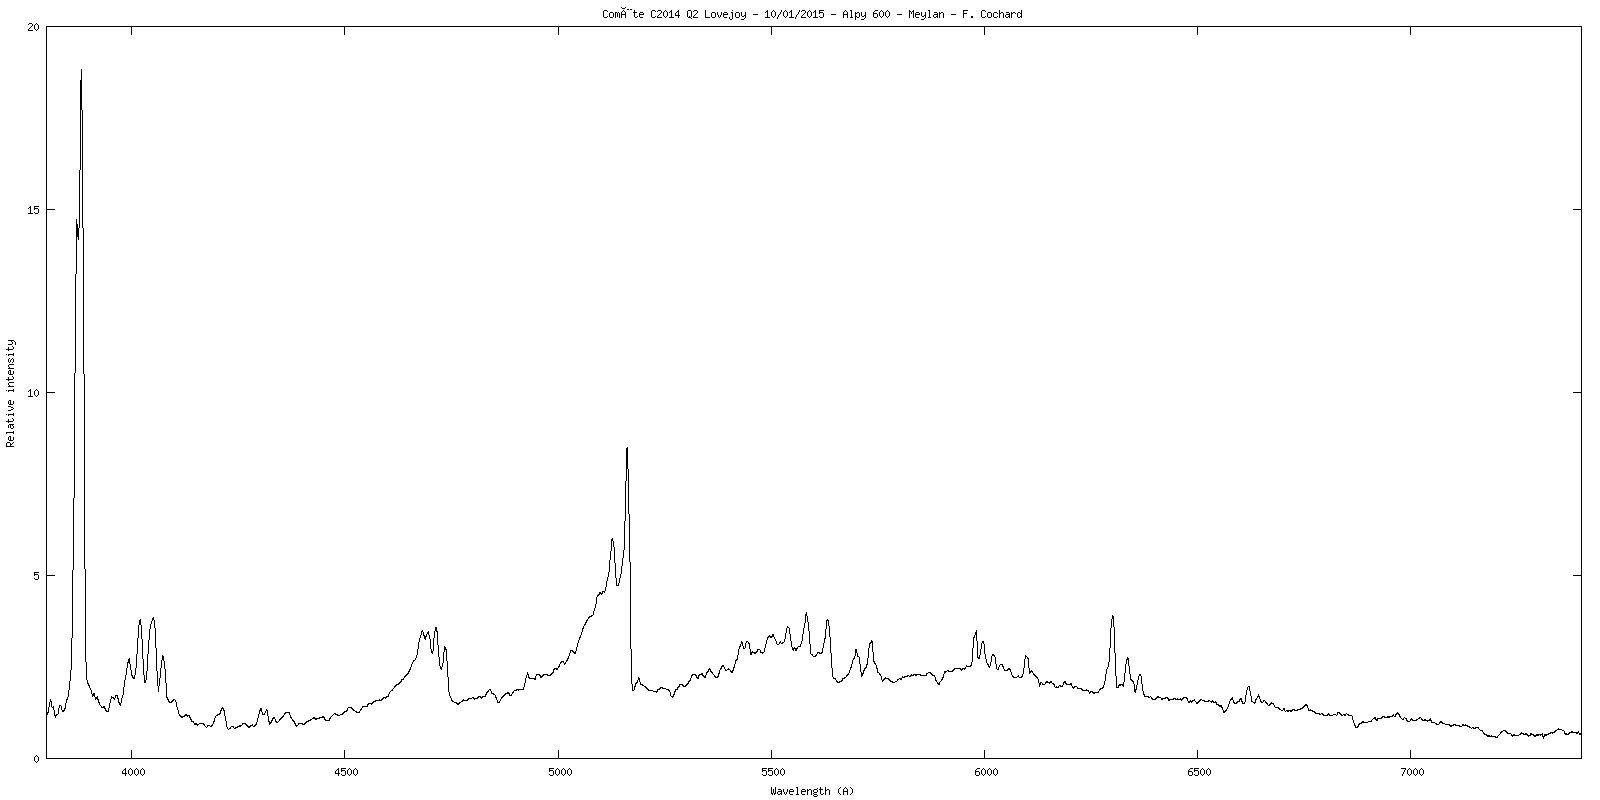
- Comet spectrum
- Comete.png (9.33 KiB) Viewed 9176 times
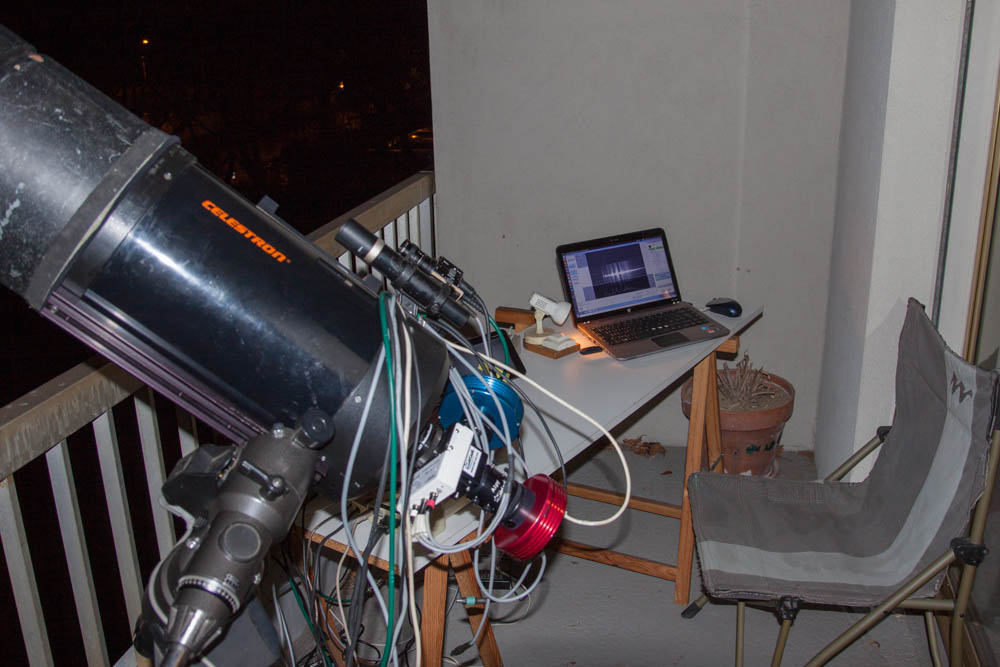
- 20150110 Comète Meylan-1.jpg (129.83 KiB) Viewed 9176 times
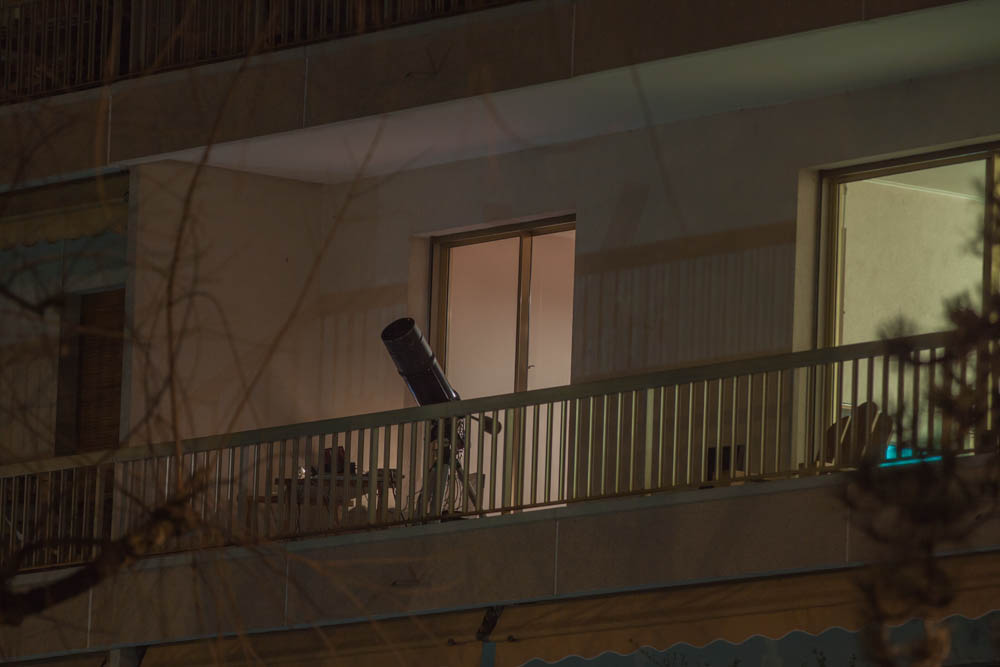
- 20150110 Comète Meylan-6.jpg (85.81 KiB) Viewed 9176 times
Not high science, but a really fun moment !
Friendly,
François
Re: C2014Q2
Posted: Mon Jan 12, 2015 3:12 pm
by Joan Guarro Flo
The Observatory REMOTE of St. Maria M. is free of fog.
Leave this graphic of comparison of the days 3 and 11 January.
J.Guarro.
Re: C2014Q2
Posted: Tue Jan 13, 2015 12:50 pm
by Joan Guarro Flo
The C / 2014 Q2, last night from Sta. Maria M.
J.Guarro.
Re: C2014Q2
Posted: Tue Jan 13, 2015 2:07 pm
by Robin Leadbeater
The change in radial velocity is impressive over the past week. I took a spectrum of the H alpha region at R~5500 last night and compared it with previous spectra in the database. At first I wondered if my wavelength calibration had gone wrong but then I realised the comet passed us on 7th January. Does anyone know if the RV relative to earth is tabulated anywhere?
Robin
Re: C2014Q2
Posted: Tue Jan 13, 2015 3:59 pm
by Martin Dubs
Hi Robin,
ephemerides including radial velocity you may find here:
http://www.imcce.fr/en/ephemerides/form ... phepos.php
A more detailed view you can generate here:
http://ssd.jpl.nasa.gov/horizons.cgi#top
quite impressive the velocity change indeed

.
Regards, Martin
Re: C2014Q2
Posted: Wed Jan 14, 2015 2:13 am
by Christian Buil
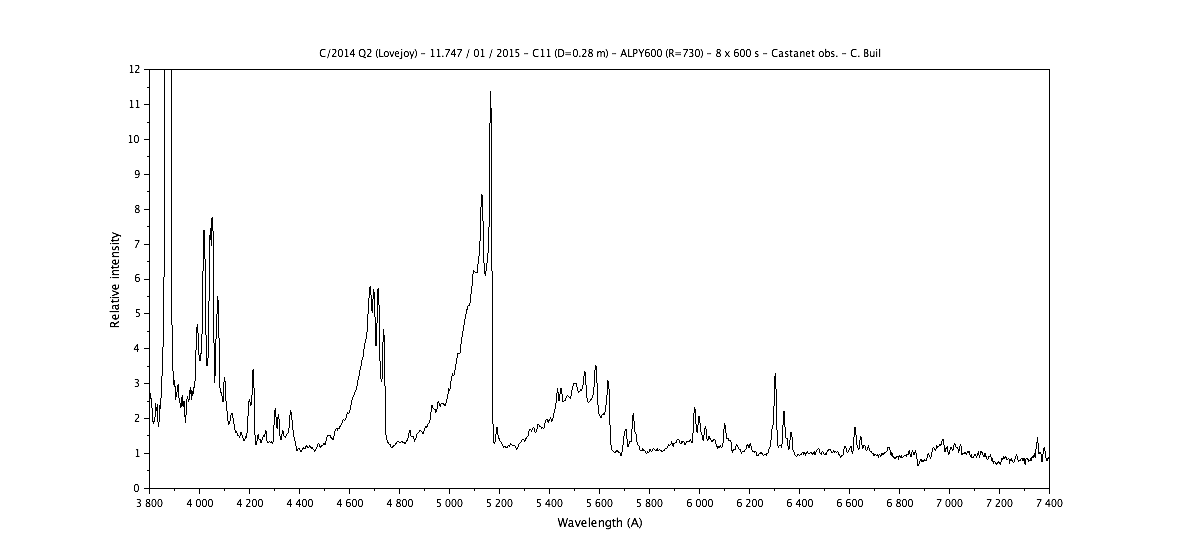
An ALPY600 spectrum taken the 11/01/2014:
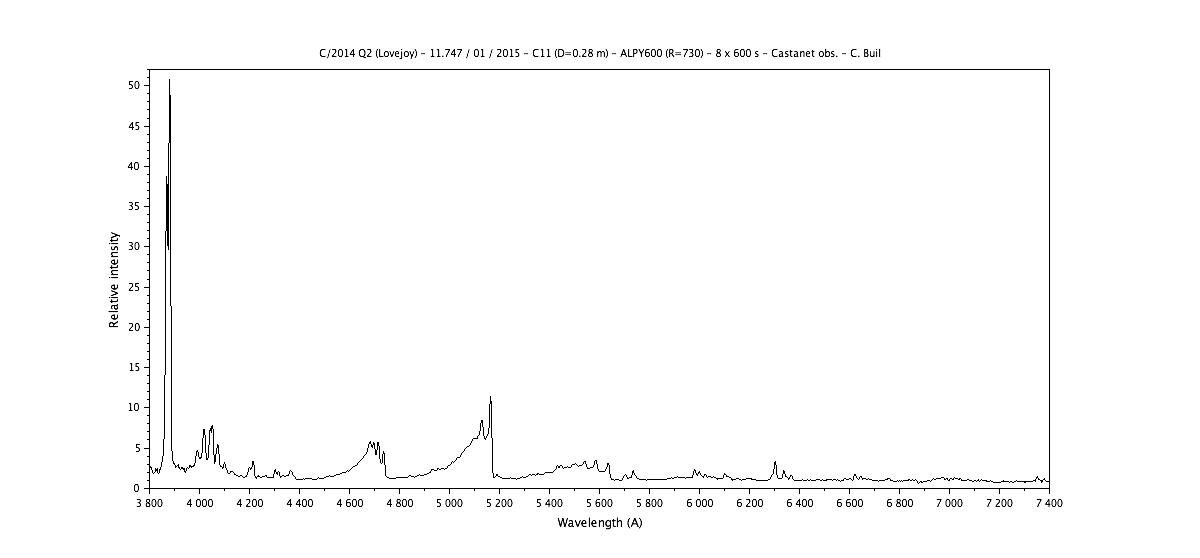
A high contrast version:
A detail of CN bands in UV. Taken with C11 and LHIRES III + 300 g/mm grating (R=1250)
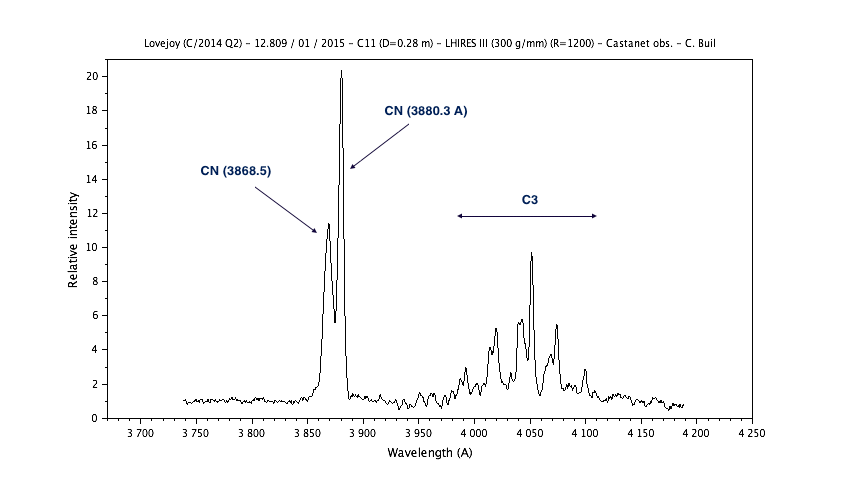
The two main UV component of CN are easy ro detect (but the lines band are not here unresolved).
With the same setup (and scale), an UV sequence of bright stars:
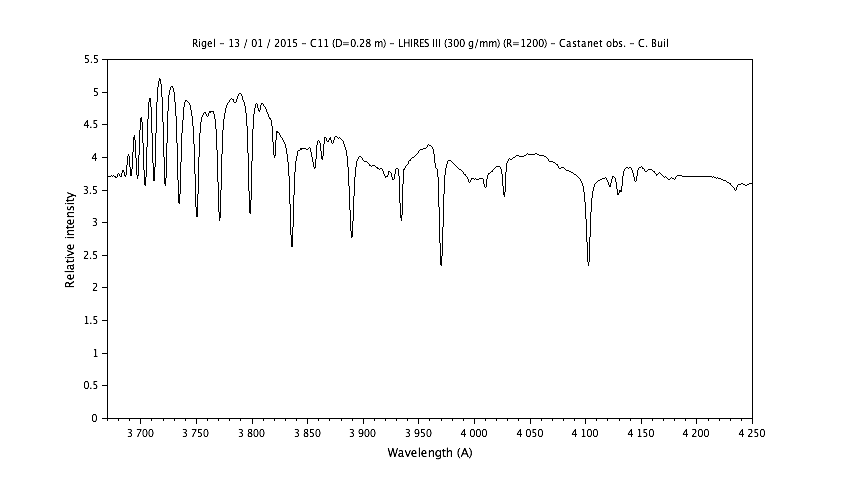
RIGEL
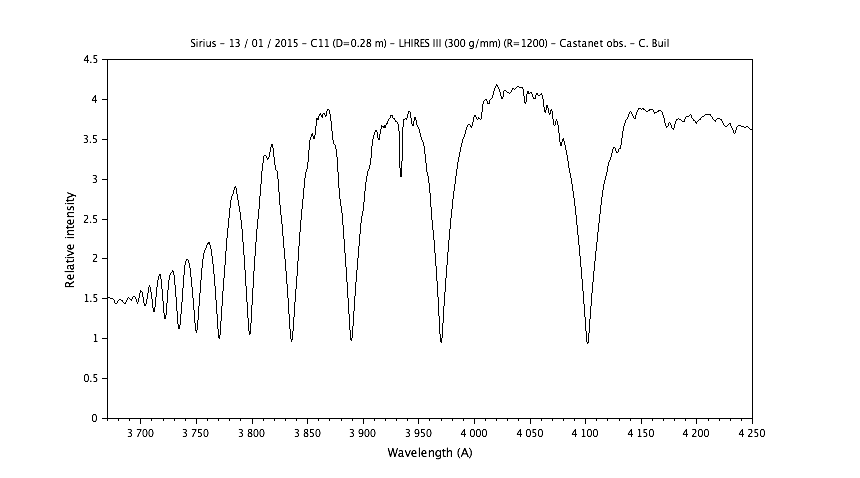
SIRIUS
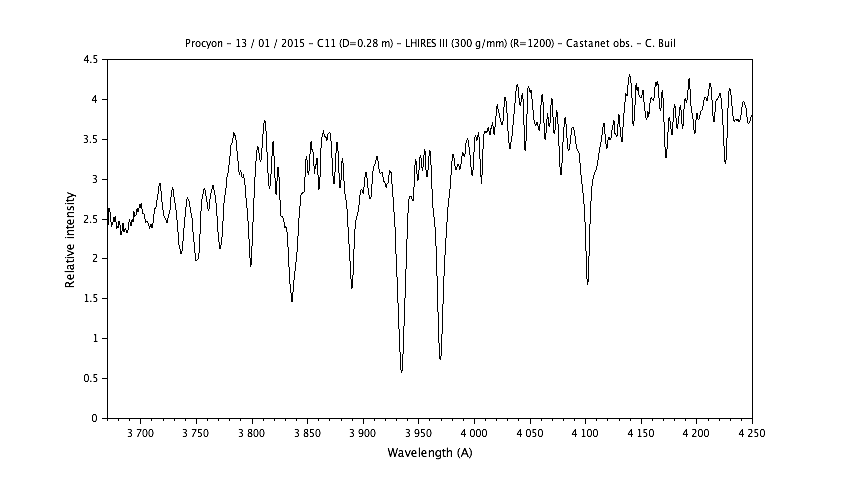
Procyon
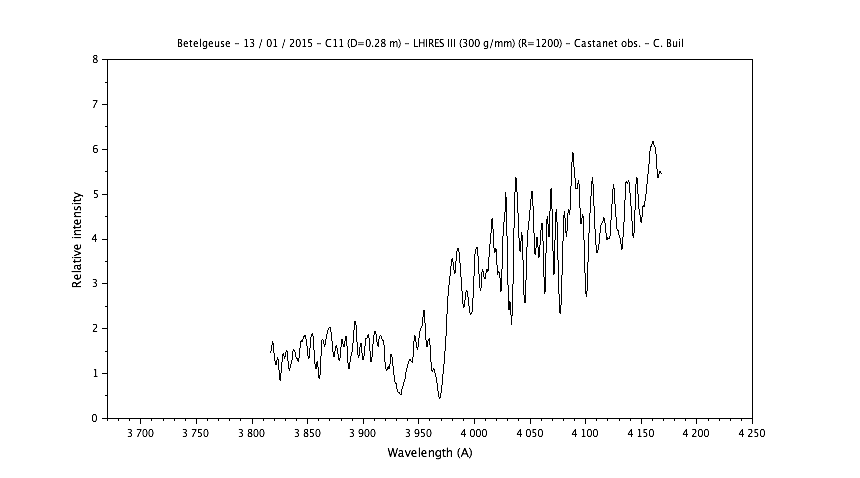
Betelgeuse
Christian B
Re: C2014Q2
Posted: Wed Jan 14, 2015 12:07 pm
by Francois Teyssier
Vraiment trés bon dans le proche IR, le Alpy !
Les raies de Balmer jusqu'à, au moins, la 15ème.
J'"attends vos pectres pour la base
Bonne continuation
François
Re: C2014Q2
Posted: Wed Jan 14, 2015 11:37 pm
by Paolo Berardi
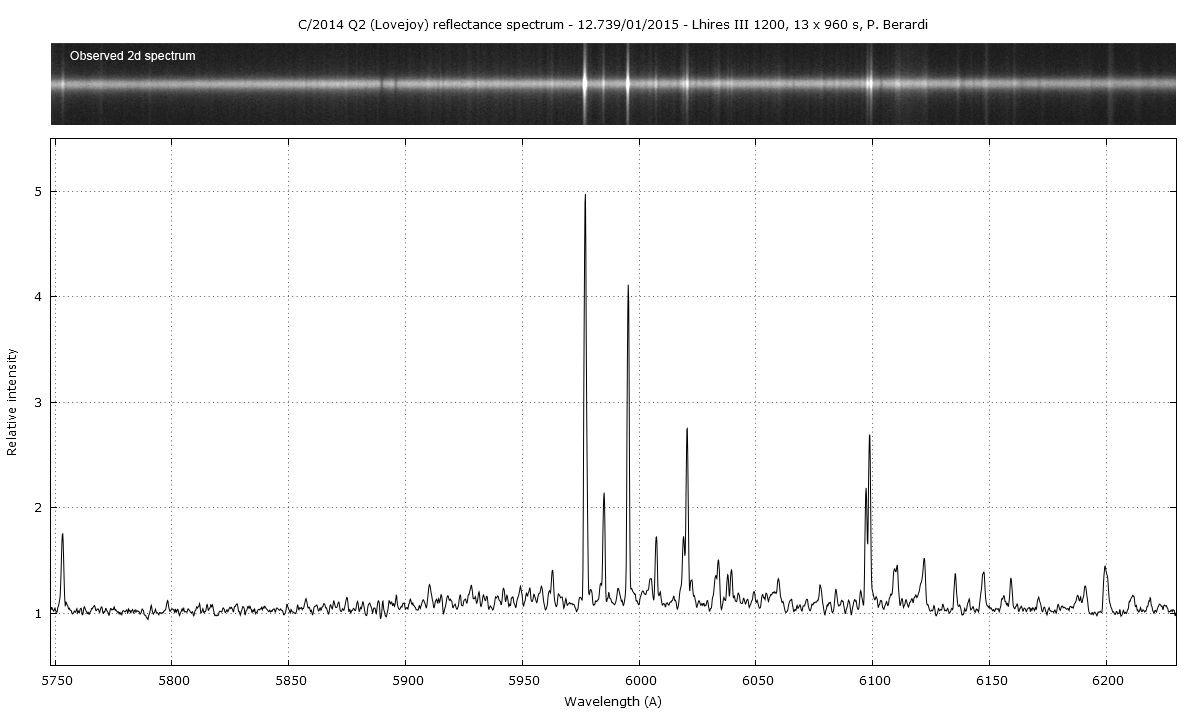
Last observations for 12 and 13 january. Reference spectrum for Sun light was obtained observing the G2V star HD13043. For its high radial velocity (and for comet relative motion) I had to shift the spectrum before calculate the comet reflectance.
Mid-res spectrum (R~5500), 5750-6230 A interval that includes Na D doublet region (no appreciable sign of emission in reflectance spectrum). Other strong lines come from NH2 and C2 molecules.
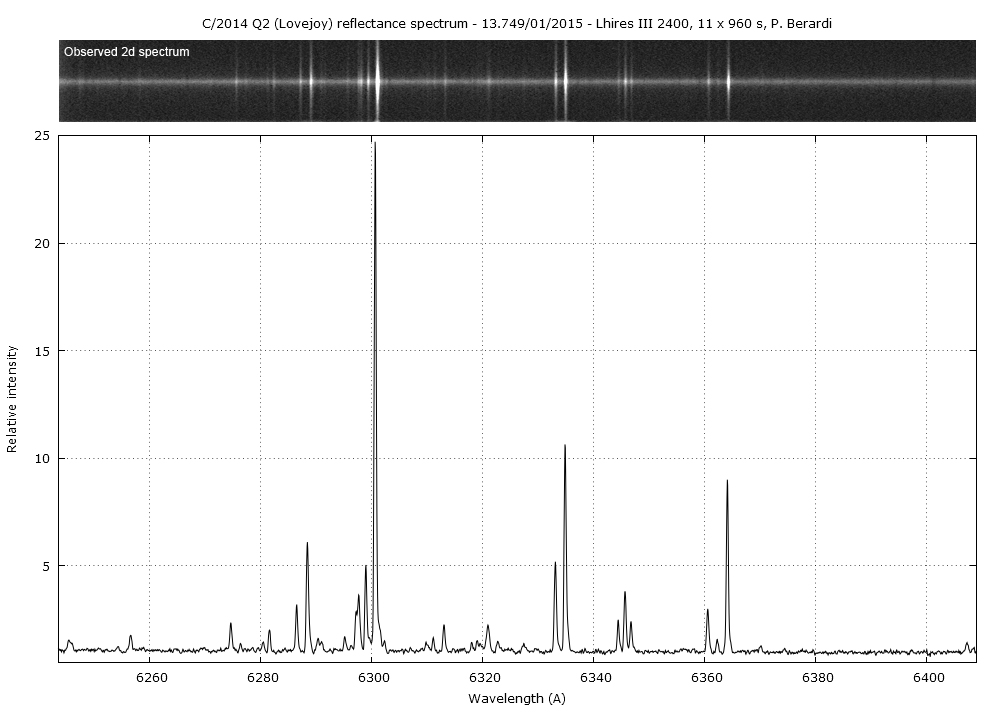
Hi-res spectrum (R~15000), 6243-6410 A interval (2400 l/mm grating) with 6300/6363 A auroral [O I] red doublet. The emission component from atmosphere airglow is very low, around 1-2 percent of cometary lines.
Paolo
PS: François, when you were taking the perfect low-res spectrum with Alpy 600 from the balcony, I took a break with spectroscopy and I went to a mountain site to photograph the comet. This is "our" Lovejoy comet on 10 january evening:
http://quasar.teoth.it/html/varie/Lovejoy_sigma.jpg
Re: C2014Q2
Posted: Fri Jan 16, 2015 2:11 pm
by Hubert Boussier
Bonjour,
Ma contribution au suivi ce cette belle comète. Le spectre a été divisé par un spectre type G2V, mais cette opération n'introduit pratiquement aucune différence sur le profil.
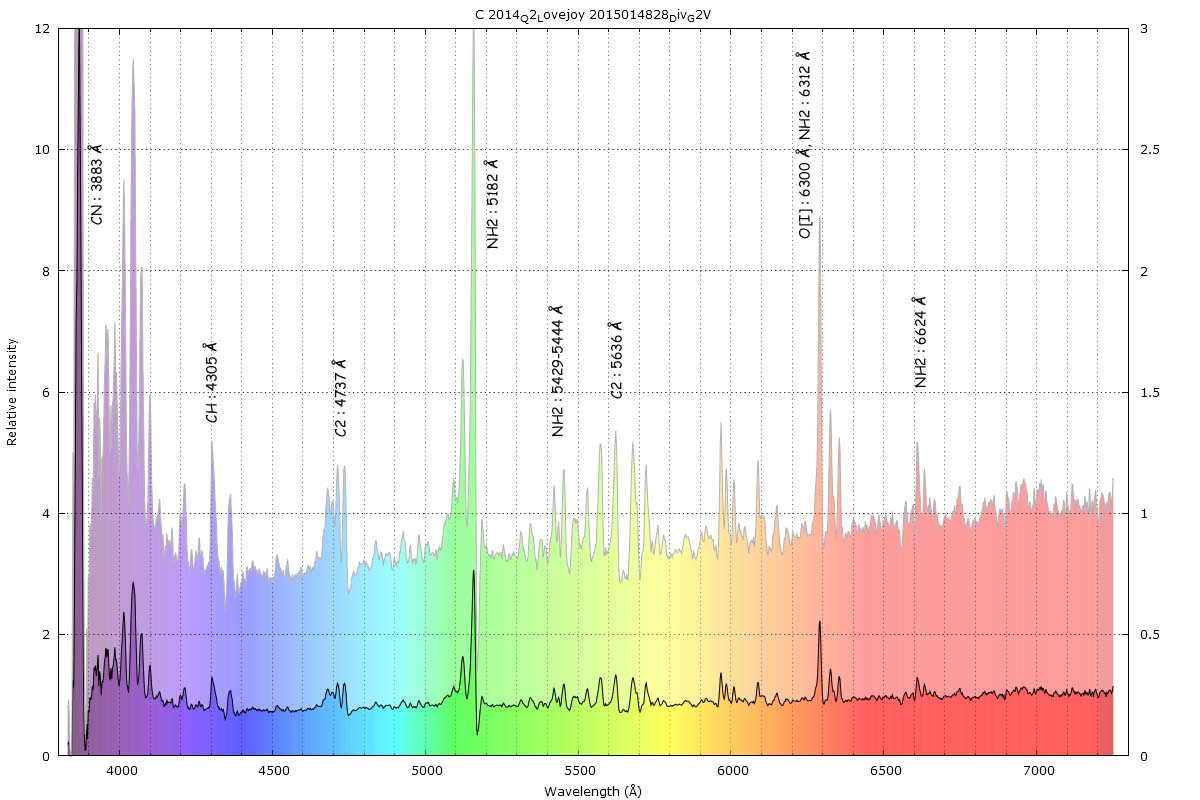
- Spectre comète C/2014 Q2 Lovejoy du 20150114 spectre divisé par spectre G2V
- C_2014_Q2_Lovejoy 2015014828_Div_G2V.jpg (156.81 KiB) Viewed 9006 times
J'ai comparé ce spectre avec ceux des zones autour de 6000 Å et 6300 Å faites par Palolo, cela me semble très cohérent.
Question, je ne sais pas comment ajouter le fichier ;fit à la base de données.
PS : Paolo, la tua foto delle cometa é bellissima.
Ciao
Re: C2014Q2
Posted: Sat Jan 17, 2015 3:09 pm
by Paolo Berardi
Hi Hubert, congratulation for your spectrum, very nice resolution with Lisa!
Le spectre a été divisé par un spectre type G2V, mais cette opération n'introduit pratiquement aucune différence sur le profil
I see absorptions to the red side of main CN/C2 headbands. They are close to strong Fraunhofer lines (calcium H,K and Mg triplet) but to understand how they are formed you should examine the two profiles before division (different spectral resolution, wavelength shift, offset,...).
Send your profile in FITS format to François T / Christian to include it in the database.
Paolo
PS: grazie mille per l'apprezzamento della foto!
