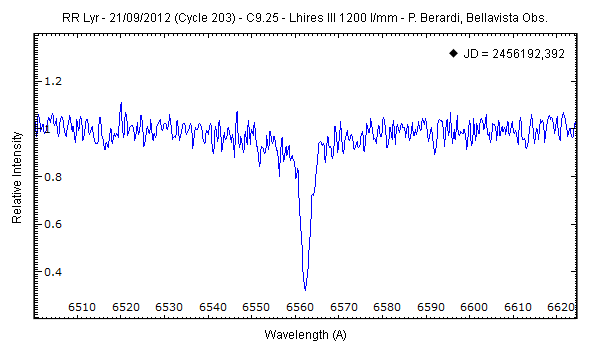
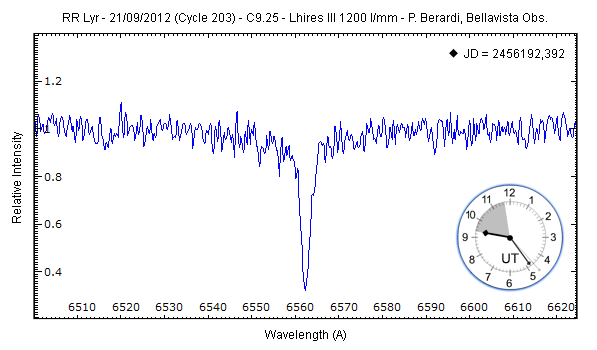
C9.25, Lhires III 1200, SXVR-H694, R=5000
29 spectra of h-alpha region, 300s each
ISIS/VSPEC
Spectra animated sequence:
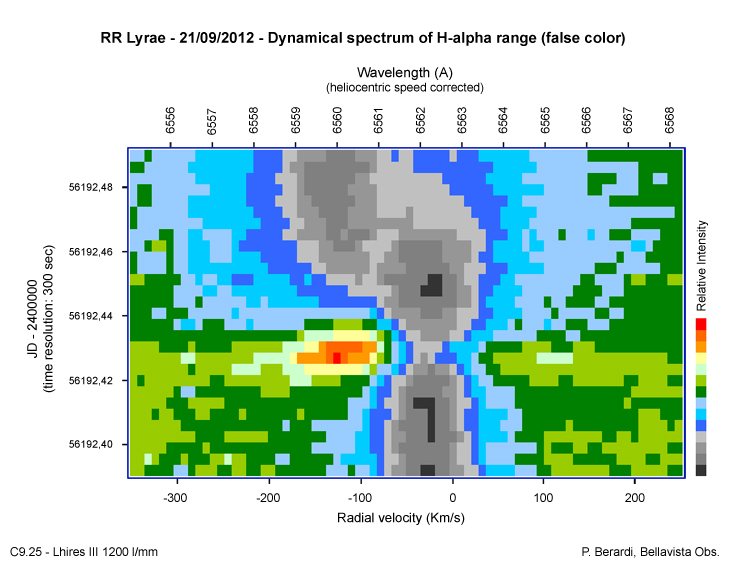
Dynamical time evolution in false color (obtained from profiles, not from 2d images):
Profile fit files (full range - from 6340 to 6795 A):
http://quasar.teoth.it/html/spectra/RR_Lyr_20120921.zip
"Didactical" animated sequence:
http://quasar.teoth.it/html/spectra/RR_ ... ock_pb.gif
Sorry for "non standard" graphics format. I need to install Gnuplot interface...
I sent observational data to Jean-Francois Le Borgne
Ciao!
Paolo