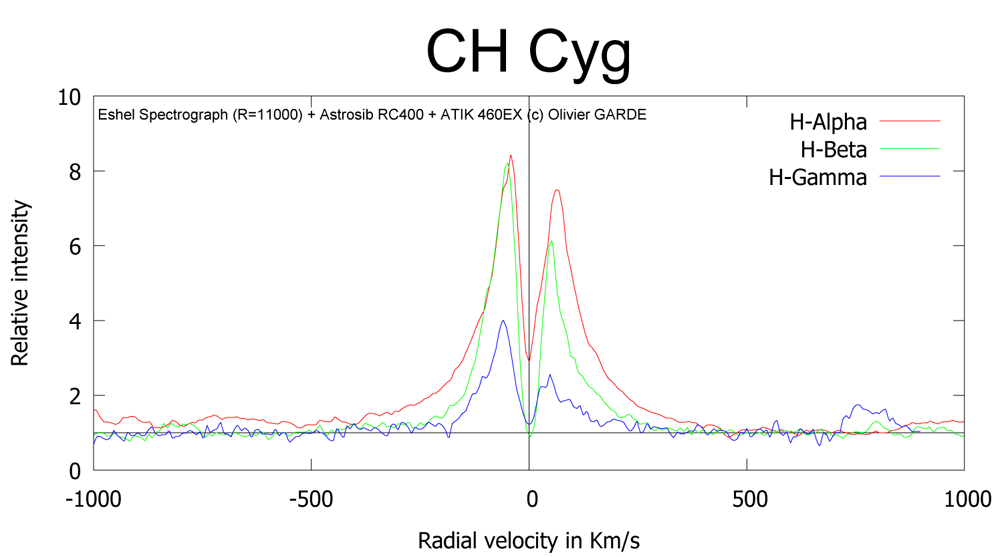
To easily create a graph of the Balmer lines ( Alpha H , H beta and H Gamma on a single graph ) , I realized a little script to obtain this result :
Vous pouvez télécharger le script ici : http://o.garde.free.fr/astro/Balmer.plt
You can download the script here : http://o.garde.free.fr/astro/Balmer.plt
Il faut fournir au scripts 3 spectres de la même cible qui contient les raies H Alpha, H Beta et H Gamma. (le script se charge ensuite de les aligner)
Ces spectres ont été préalablement corrigé de la vitesse propre de la cible ainsi que de la vitesse héliocentrique, ils sont également normalisés.
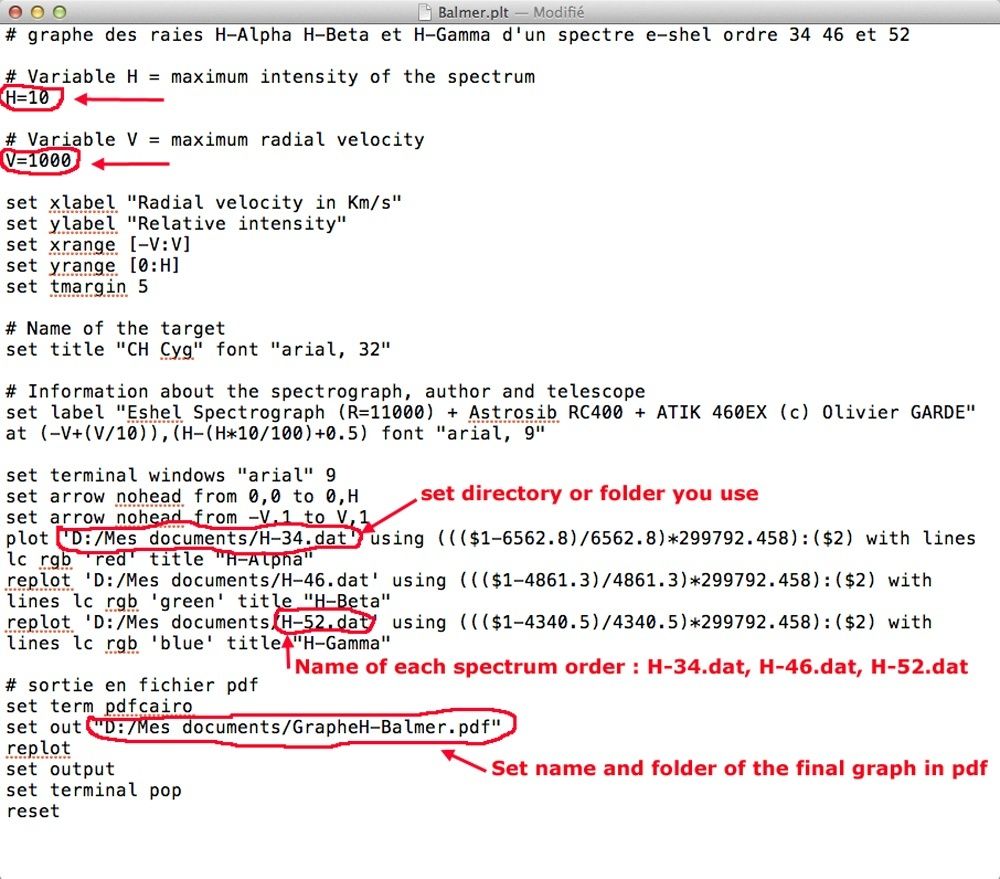
Gnuplot ne prenant en compte que des fichiers .dat, il faut donc convertir les fichiers des spectres .fit en .dat et les nommer : H-34.dat pour H-alpha, H-46.dat pour H-Beta et H-52.dat pour H gamma (noms arbitraires reprenant les ordres du spectro e-shel ou figure les raies de Balmer)
You have to provide 3 spectra of the same target that contains the lines Alpha H, H and H Beta Gamma. (The script do aligne the spectra)
These spectra were corrected beforehand of the own velocity of the target and the heliocentric speed, they are also normalized.
Because Gnuplot only process .dat files, you have to convert yours files from .fit to .dat and name them : H-34.dat for H-alpha, H-46.dat for H and H-Beta 52.dat for H gamma (arbitrary names)
On peut bien sur modifier le script :
La variable H correspond au maxi en intensité du graphe
La variable V correspond à la plage de vitesse radial que l'on souhaite afficher
You can of course edit the script:
The H variable is the maximum intensity of the graph
The variable V is the radial velocity range that you want to display
Le graphe en sortie est au format pdf mais on peut facilement changer par exemple pour un fichier PNG en changeant la ligne "set term pdfcairo" par "set term pngcairo" dans un éditeur de texte classique.
The graph output is in pdf format but it can easily be changed for example for a PNG file by changing the line "set term pdfcairo" with "set term pngcairo" in a classic text editor.
Pour lancer le script, il faut lancer le programme Gnuplot et faire un copier/coller du script, puis le coller dans la ligne de commande du programme, le graphe s'affiche alors et est également sauvegardé automatiquement dans le répertoire à définir dans le script.
To run the script, you must first launch the program Gnuplot and copy / paste the script, and then paste the script in the program command line, the graph is displayed and is also automatically saved in the directory defined in the script .